Help
Getting started, workflows, exports, keyboard shortcuts, and FAQ. Pick a topic, or filter across everything.
Getting Started
TestDossier turns manual tests and CI runs into evidence you can review, share, or export. Reviewers can comment and sign off without a paid seat. Anonymous and Free projects are saved in this browser; QA Pro projects and QA Team workspaces sync to the cloud. Sharing and other connected features send only the data needed for that feature.
Popular tasks
Your first evidence doc
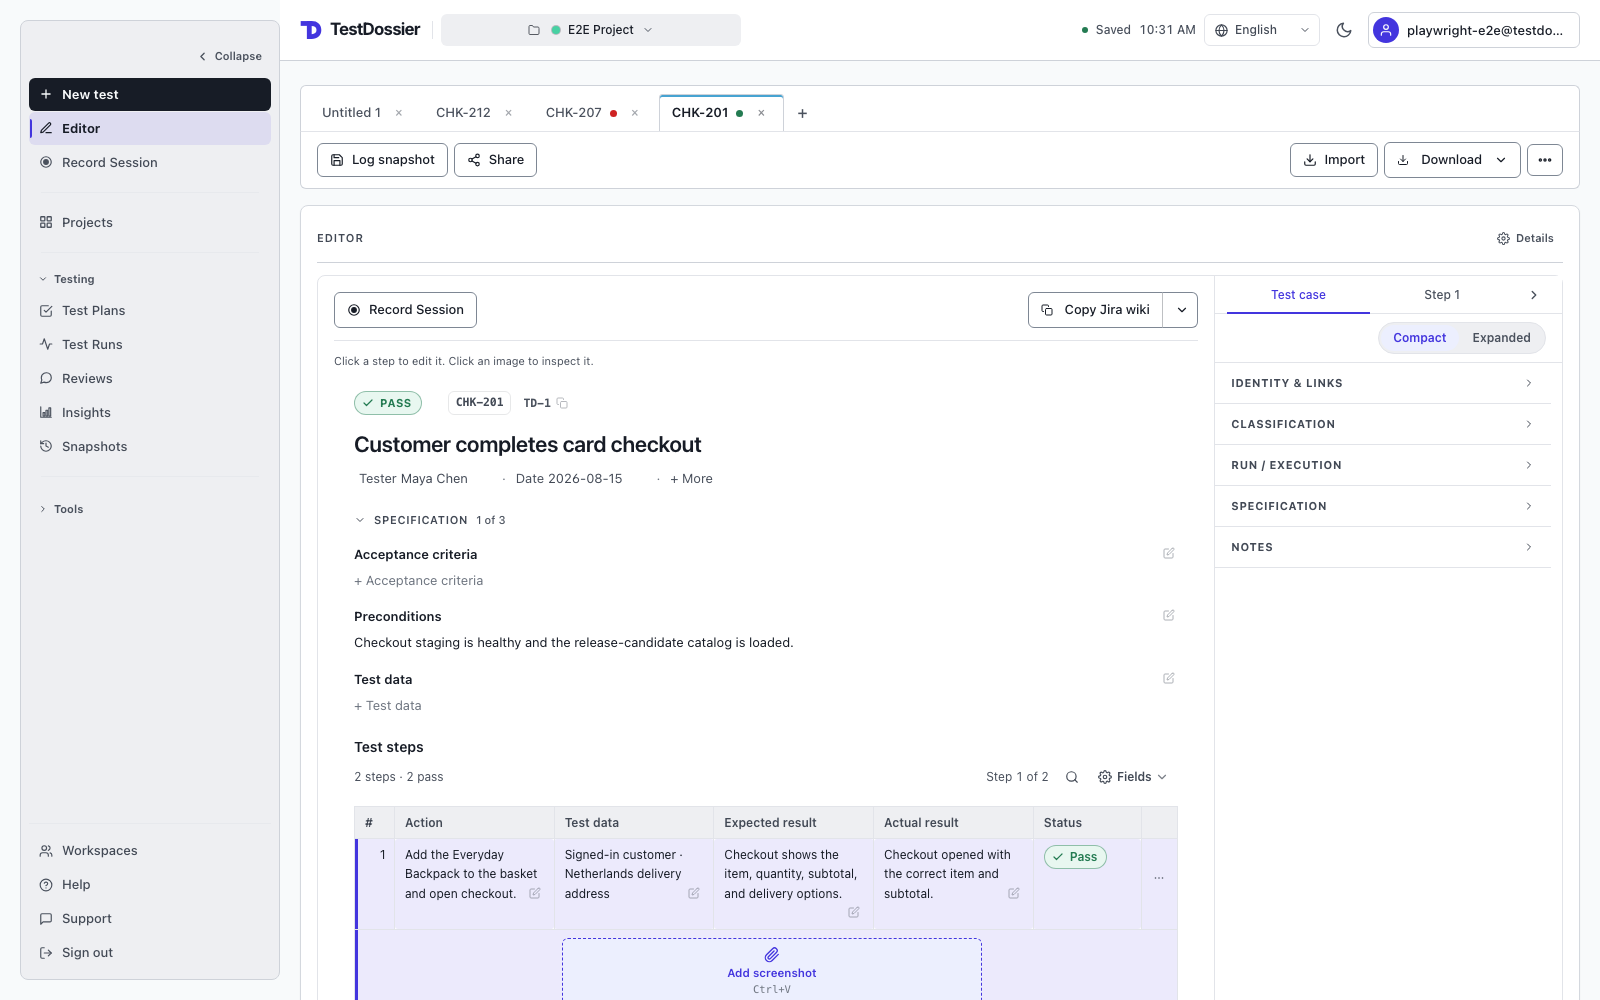
- Write the title (the summary) at the top of the document and add a ticket in the Details rail under Identity & links — the Test Case ID is auto-assigned.
- In the steps table, select the first Action cell and type what you did.
- Paste a screenshot with
Ctrl/⌘+Vanywhere on the page. It attaches to the active step. - Fill Expected and Actual in the row. Select the result chip to pick the step's result, or press 1–5 on the active row.
- Select + Add step under the table and repeat, or use From template for pre-shaped steps (Login, API call, etc.).
- When the execution is complete, select Log snapshot. Use Share in the editor toolbar for a read-only review link. For a file export, expand Tools in the sidebar and select Export.
Starting from an existing spec
Select Import in the editor toolbar. If the button is hidden on a narrow screen, open ••• More and select Import. Then choose From markdown, paste your table, review the detected cases, and choose where to save them.
Working on multiple tickets
Select + above the editor to create another test case. Each open test case keeps its own ticket, steps, and screenshots. Switching between test cases is instant, and changes autosave.
Supported imports and CI formats
Import from another test tool (CSV / Excel / XML / JSON / Gherkin)
Select Import in the editor toolbar. On a narrow screen, find it under ••• More; it is also available by expanding Tools in the left sidebar. Supported files are CSV, Excel (.xlsx), XML, JSON, Gherkin (.feature), and TestDossier ZIP backups. TestDossier recognizes layouts from TestRail, Zephyr Scale, Xray, Qase, Azure DevOps, TestLink, and Cucumber/Gherkin. For an unfamiliar CSV, review the preview and map each source column to a TestDossier field.
CI integration
POST CI results to /api/ci/ingest with Authorization: Bearer <token>. Three input families cover five formats:
- Generic JSON: a
testsarray; each test acceptsname,ticket,dossier_id,result,duration_ms,failure_message, andsteps. - JUnit XML: send
Content-Type: application/xmlwith the standard JUnit report. Cypress, Playwright, pytest, Mocha, Jest all emit this when configured. - Cypress / Playwright / Cucumber JSON: native runner output with the header
X-CI-Format: cypress,playwrightorcucumber. Carries retry attempts, artifact metadata and (Cucumber) Gherkin steps — richer than JUnit.
Import
Restore a project or case from a backup
Anything you export from Test Dossier you can drop straight back in — a whole project or a single case, with screenshots. Use it to move work between devices, recover a backup, or seed a new project from an old one.
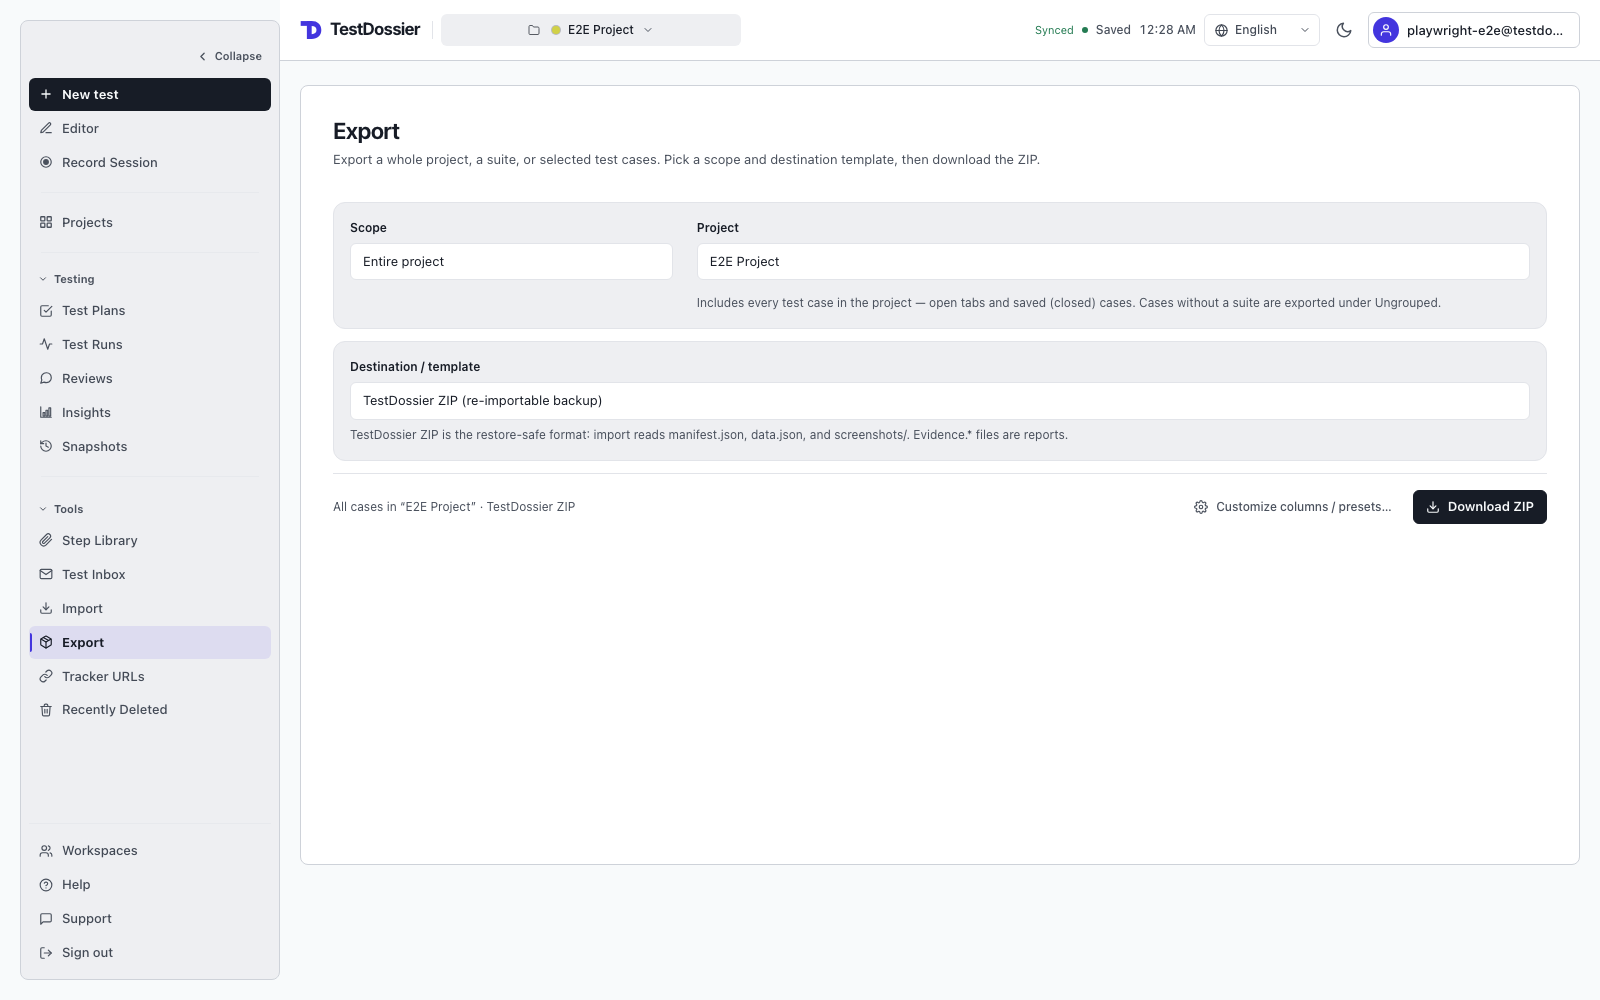
- Choose the right backup: use ZIP Bundle (current test case) or All Open Test Cases ZIP in the right-side Output panel; for every case in a project, expand Tools and choose Export → Entire project → TestDossier ZIP.
- Select Import in the editor toolbar (or under ••• More on a narrow screen), then drop the
.zipor backup.json. - Test Dossier recognises its own export and switches to restore — Test Case IDs, verdicts and evidence are preserved, not re-parsed into new cases.
- Pick the destination: a New project (the default—keeps the original Test Case IDs) or an existing one. Restored cases are saved without opening them in the editor. To find them, select Projects, open the destination project, and use its Cases list.
Import test cases from a spec or AI
Use when you already have a structured list of test cases — from a spec doc, Confluence page, Google Sheet, or an AI-generated table — and don't want to type each one.
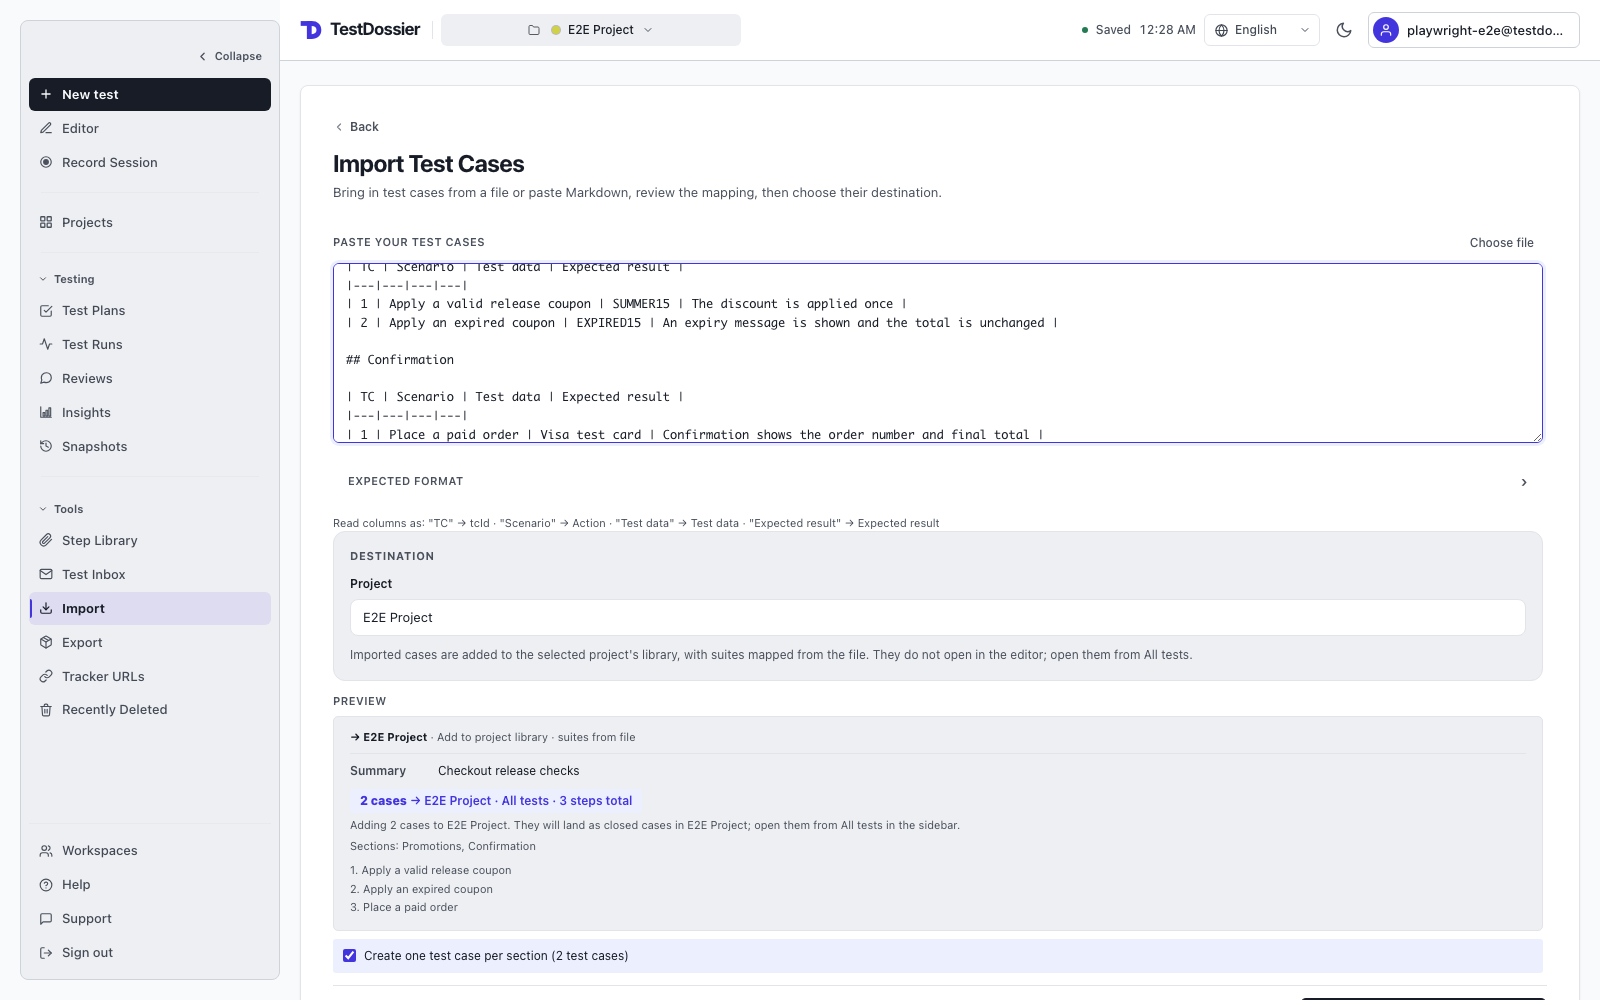
- Select Import in the editor toolbar. If it is hidden, open ••• More. Then choose From markdown.
- Paste a markdown table. Columns are matched flexibly: the parser recognises Scenario / Action / What to test / Step description (becomes Action), Test Data / Input / Condition / Precondition (becomes Test Data), and Expected / Result / Outcome / Verify (becomes Expected). A TC or # column is auto-ignored — steps are numbered by the tool.
- Optional: include a heading above the table. Headings and separate tables can be detected as distinct cases or sections; confirm the result in Preview.
- When importing into a project, test cases are saved to that project's Cases list. Without a project destination, a small import can open the new test cases directly in the editor.
- The preview below the paste area shows how many steps will be created and which sections were detected. If something looks wrong, fix the markdown and re-paste.
- Select the primary button. Its label confirms the result, such as Open 2 test cases or Import 12 cases.
Import from another test tool (CSV / Excel / XML / JSON / Gherkin)
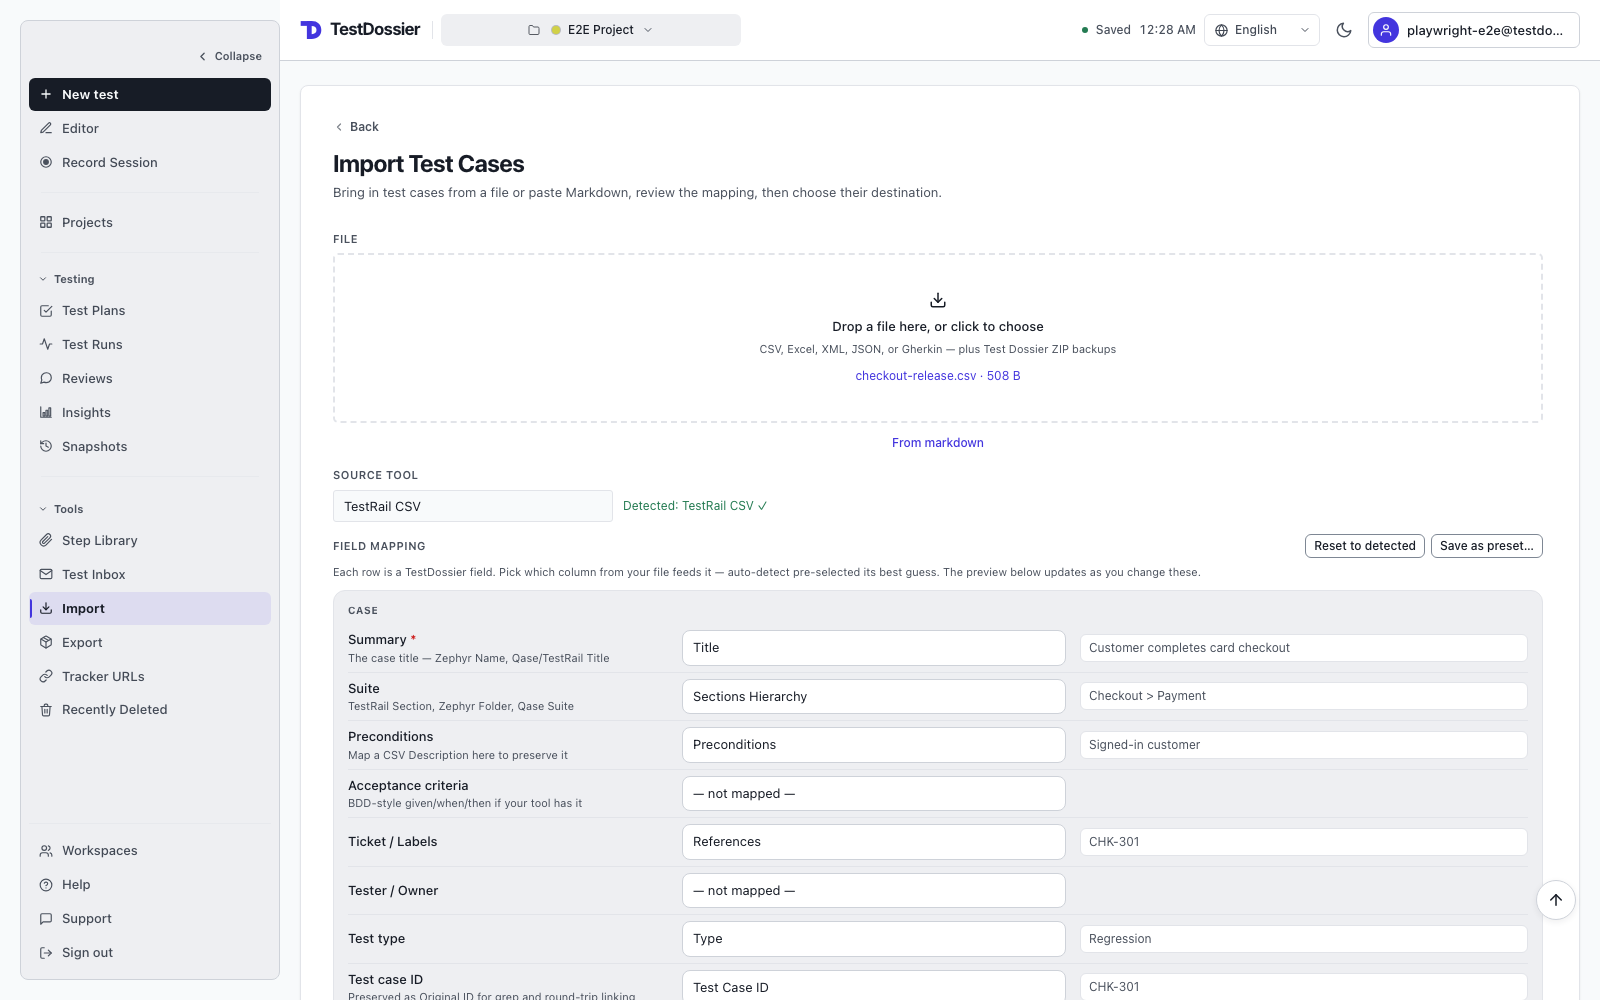
Select Import in the editor toolbar. On a narrow screen, find it under ••• More; it is also available by expanding Tools in the left sidebar. Supported files are CSV, Excel (.xlsx), XML, JSON, Gherkin (.feature), and TestDossier ZIP backups. TestDossier recognizes layouts from TestRail, Zephyr Scale, Xray, Qase, Azure DevOps, TestLink, and Cucumber/Gherkin. For an unfamiliar CSV, review the preview and map each source column to a TestDossier field.
Export
Jira (evidence as a comment)
Best when your Jira ticket is a story or bug and you're posting test evidence alongside it.
- Select ZIP Bundle (current test case). A ZIP file downloads.
- Unzip it — you get
evidence.html,evidence.jira,evidence.md,evidence.txt,evidence.junit.xml,README.txt, adata.jsonportable snapshot, and ascreenshots/folder. - In Jira, open the ticket. Drag all files from
screenshots/into Jira's attachment area. - For Jira Server / Data Center: open
evidence.jira, copy, paste into a new comment. - For Jira Cloud, attach the screenshots first, then paste the contents of
evidence.mdinto a rich-text field. Jira converts supported Markdown as you edit. Check image placement before posting; attachment filenames are not guaranteed to resolve automatically.
evidence.html is best for emailing or printing to PDF — it's a self-contained report with images embedded. evidence.txt is real plain text for tools that strip formatting. Result badges (✅ PASS, ❌ FAIL etc.) use shape-encoded emoji + bold so they render cleanly everywhere without depending on legacy color macros — and they survive monochrome / colorblind contexts where green/red discs would be ambiguous.
Vendor workflow checked August 2026 · Jira Cloud formatting documentation
TestRail (import as test cases)
Use when you want the test to become a reusable case in your TestRail library.
- Expand Tools in the sidebar and select Export. Choose the project, suite, or cases to export, then select TestRail CSV as the format and download the ZIP.
- In TestRail, open the target suite and click the Import icon. Choose Import from CSV and upload
cases.csv. - On Row Layout, pick Test cases use multiple rows. Set Title as the column that starts a new case.
- Column mapping should auto-fill (Section, Title, Steps, Expected Result, etc.). The Section column reads from your TD suite name, so a suite-organized project round-trips into TestRail's folder hierarchy without manual sorting. Cases without a suite land in TestRail's root section.
- Open each imported case and attach files from the
screenshots/folder to the right steps.
Vendor workflow checked August 2026 · TestRail CSV import documentation
PractiTest (import tests with steps)
- Expand Tools in the sidebar and select Export. Choose a scope, select PractiTest CSV as the format, and download the ZIP.
- In PractiTest, open Project Settings → Import & Export → Import Tests.
- Upload
cases.csv. Ensure UTF-8 encoding is selected. - Map each CSV column to the matching PractiTest field. The first row of a test contains its test-level information and first step; additional rows contain that test's remaining steps.
- After import, attach screenshots to individual steps.
---). To log an execution proper, add the imported case to a Test Run / Test Cycle in the target tool.
Vendor workflow checked August 2026 · PractiTest import documentation
JUnit XML (TestRail / PractiTest / Xray / CI tools)
Every evidence ZIP includes evidence.junit.xml. It contains one <testcase> per TestDossier step; failures use <failure>, with additional detail in <properties> and <system-out>. Use it with systems that explicitly accept JUnit execution results, and verify how the destination maps suites, cases, and steps. To create reusable manual cases, use the destination's CSV or XLSX export instead.
Format boundary checked August 2026 · Xray result-import documentation
Turn CI results into reviewable draft cases
POST results to /api/ci/ingest with a project access token that has CI ingestion enabled. When the report contains authored steps, TestDossier creates a draft case for human review. The draft uses the structure in your report; TestDossier does not invent steps with AI.
Three shipped ways to carry that structure:
- Playwright — wrap work in
test.step('action → expected', …). The→(or->) splits action vs expected; a[TD:<id>]in the test title is the stable identity. Send withX-CI-Format: playwright. - JUnit (any runner) — emit per-testcase
<properties>:td:step:1:action,td:step:1:expected,td:step:1:result, andtd:dossierfor stable identity. Send asContent-Type: application/xml(noX-CI-Formatneeded for JUnit). - Cucumber / Gherkin (Selenium, SpecFlow, Behave, pytest-bdd, cypress-cucumber) — post the standard cucumber JSON with
X-CI-Format: cucumber.Given/Whenbecome step actions and theThenclause is the expected result; the scenario description becomes the case notes; a@TD-<id>tag pins identity.
curl --fail-with-body --retry 5 --retry-connrefused --retry-max-time 360 -X POST https://testdossier.com/api/ci/ingest \
  -H "Authorization: Bearer $TD_TOKEN" \
  -H "Content-Type: application/xml" \
--data-binary @junit-results.xml[TD:<id>] or td:dossier so later executions resolve to the same case. After the draft is reviewed, CI results stay attached to that case inside Test Runs without silently rewriting its definition.
Uploaded screenshots travel with the run. Inline image data and durable HTTPS image URLs attach to the case's steps and appear in shared report links exactly like a screenshot you paste in yourself. A request keeps up to 100 screenshots (25 per test), with hosted and uploaded images using the same caps. Native Playwright JSON contains runner-local paths rather than image bytes; use the supplied wrapper or convert the files before the runner disappears. Large runs scale through pages bounded by both 200 tests and 25 MB.
Other tools (Zephyr Scale, Xray, Qase, Azure DevOps, TestLink)
Expand Tools in the sidebar and select Export. Choose a project, suite, or specific cases, then choose the vendor from Format. The downloaded ZIP contains the mapped test-case file, a screenshots/ folder, and vendor-specific guidance where available.
- Zephyr Scale — Atlassian Marketplace plugin (formerly TM4J). Step-by-step test script format.
- Xray Cloud — Atlassian Marketplace plugin. Manual test type, one row per step.
- Qase — Qase v2 CSV mapping with one row per case and numbered steps in a quoted cell.
- Azure DevOps Test Plans — Microsoft work-item grid format.
- TestLink — open-source test management.
Custom export mapping (any tool)
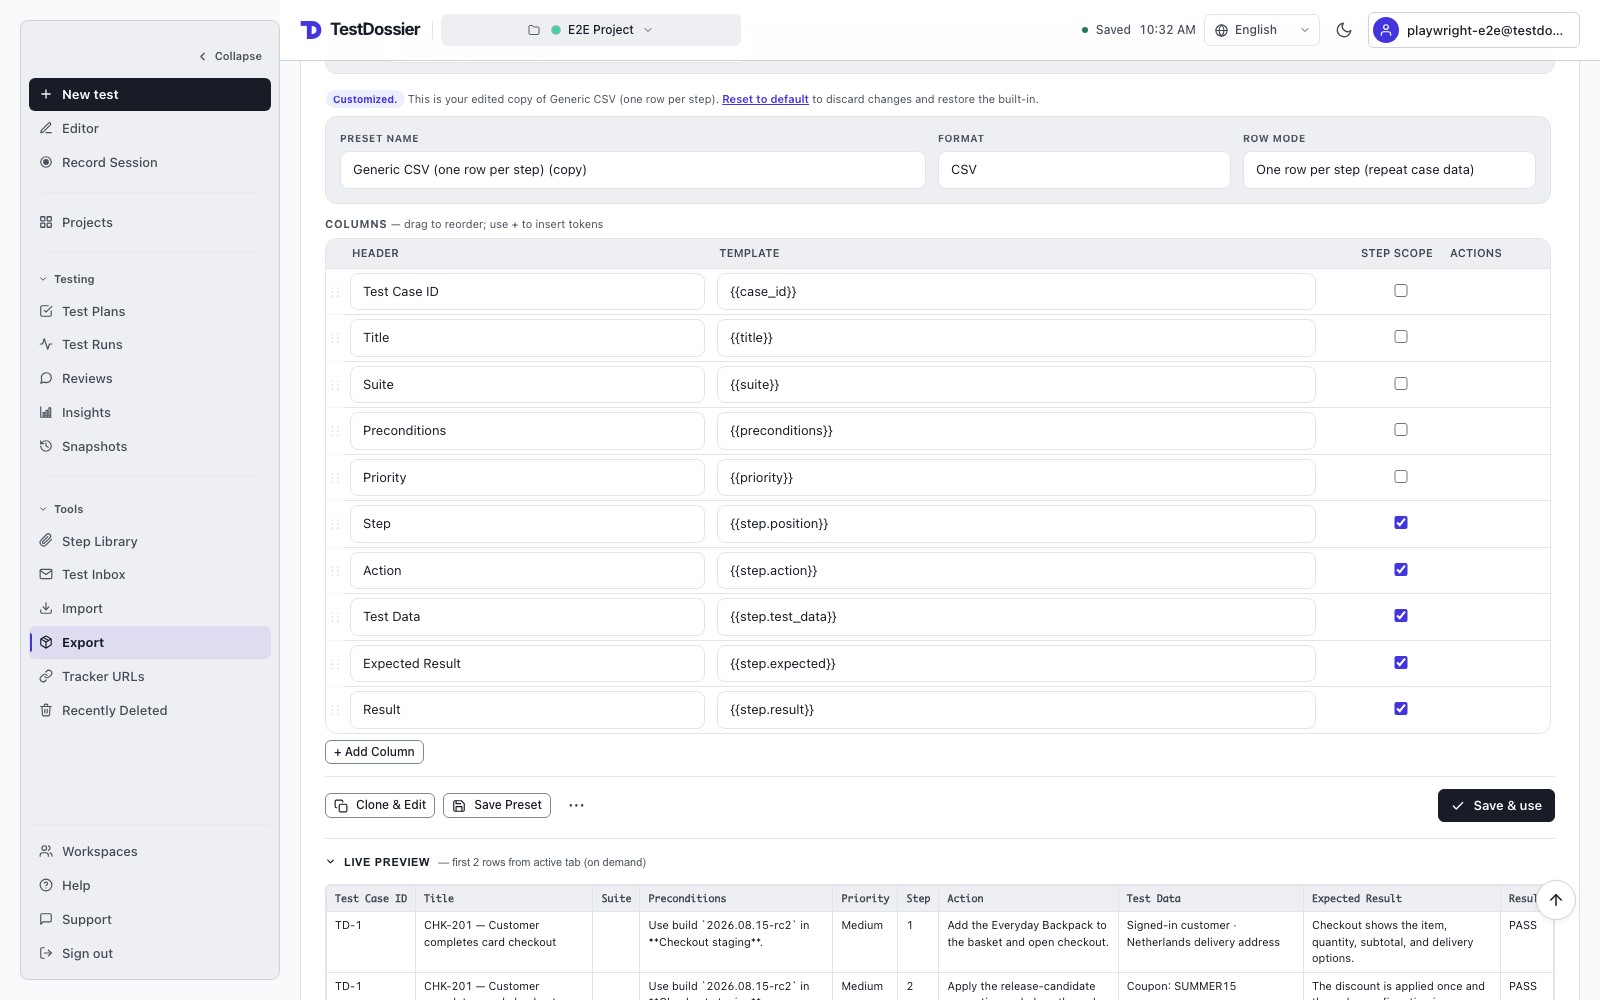
If your test management tool is not listed, or your team uses a custom CSV schema, expand Tools, select Export, then choose Customize columns / presets…. You can:
- Pick any built-in preset, click Clone & Edit, and tweak it.
- Build a mapping from scratch: add columns, set headers, and drop in
{{token}}placeholders for any field. The token picker shows everything available (case-level:{{title}},{{summary}},{{preconditions}}, etc.; step-level:{{step.action}},{{step.expected}},{{step.result}},{{step.attachments}}, etc.). - Toggle row mode between "one row per case" (case columns blank on continuation rows — TestRail/Zephyr style) and "one row per step" (case columns repeat — Xray style).
- Choose CSV or Excel output.
- Save Preset stores it in your browser. Export Preset JSON shares it with teammates — they can Import Preset JSON to use the same mapping.
- The Live Preview pane shows the first 2 rows so you can see the result before downloading.
Backup formats and scope
Use TestDossier backups to move cases between devices, recover local work, or archive a project outside the service.
- ZIP Bundle (current test case) downloads the active case as a re-importable
.zipwith its portable data, report files, and screenshots. - Import reads TestDossier ZIP backups and older JSON backups, asks for a destination, and adds the restored cases to that project's Cases list. Existing cases are not overwritten.
manifest.json, portable data.json for each case, and its screenshots/. Import validates that structure and explains what is missing instead of failing silently.
Features
Account and security
Team roles & audit log
QA Team workspaces have three roles. Owners hold billing, role changes, and danger-zone actions. Admins manage the team — invites, removing members, renaming the workspace, and branding — without touching billing or roles. Members read and write workspace data. Change a member's role from Workspaces → Manage → Members (owners only); choose the role when inviting.
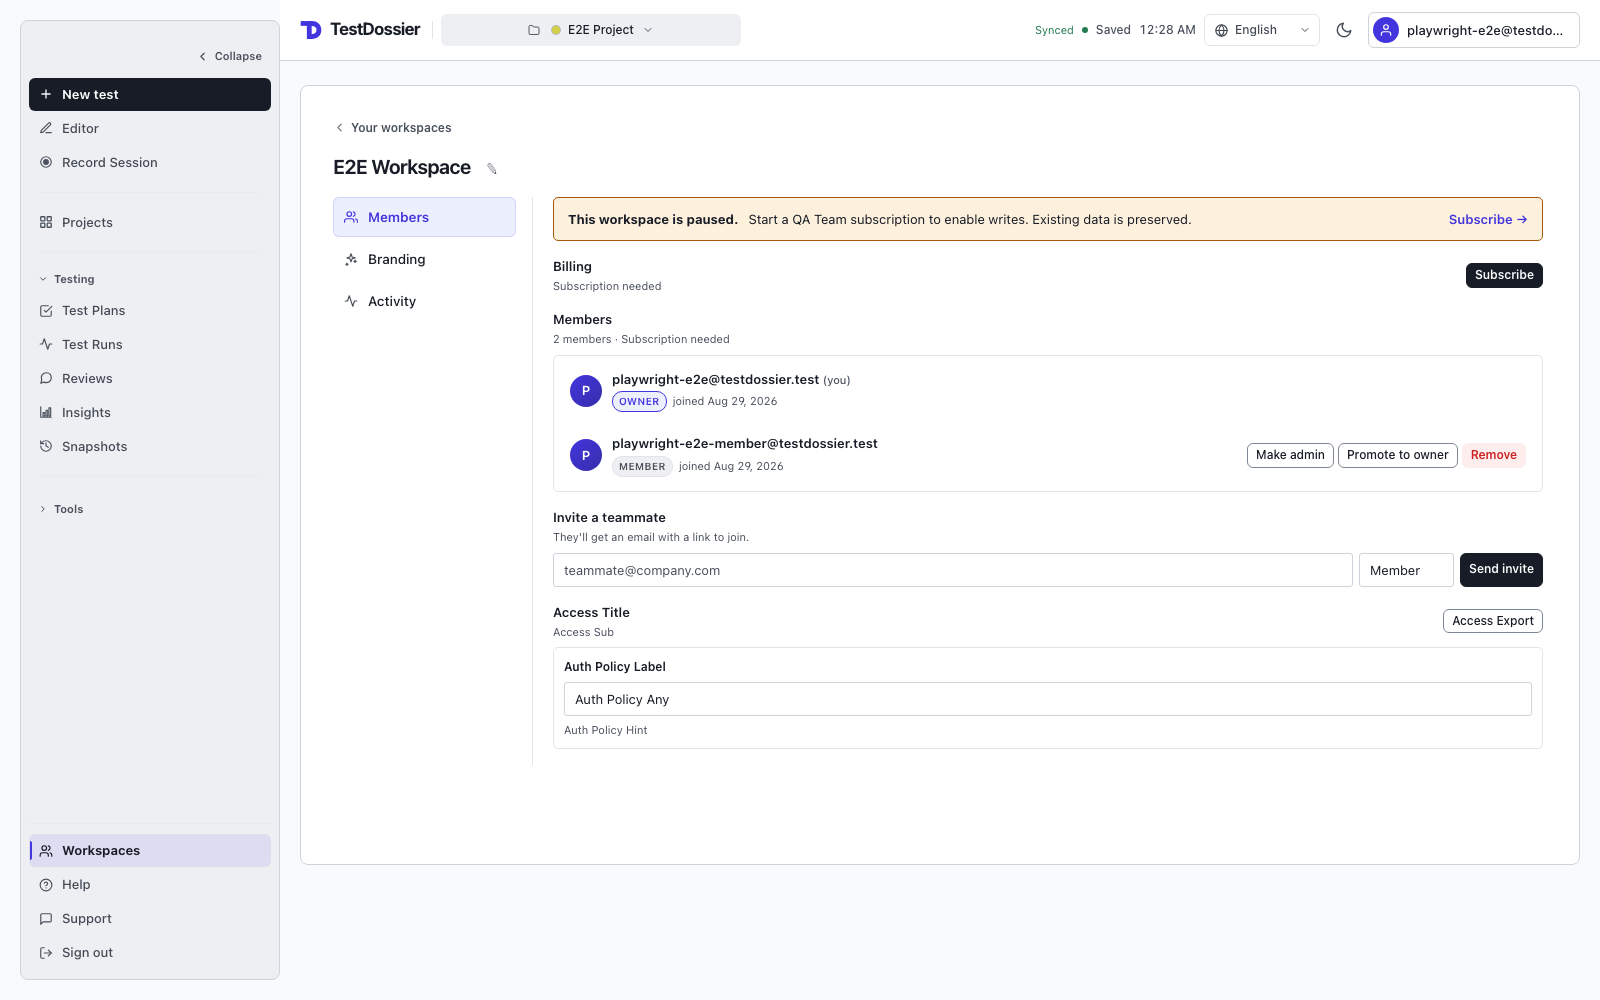
Every membership, role, share, and data action lands in the workspace Activity pane. Filter it by category (team, test cases, runs & plans, shares), and — as an owner or admin — use Export CSV to download the audit trail for compliance reviews.
Audit feed for a SIEM. Owners can mint a read-only audit-feed token from Workspaces → Manage → Members → Audit feed. Point a collector at /api/workspaces/<id>/audit-feed with Authorization: Bearer <token>; events arrive oldest-first with a next_cursor to persist between pulls, and ?format=csv returns the same columns as Export CSV. Revoke a token from the same screen when a collector is retired.
Export workspace data. Owners and admins can select Export workspace data under Access to download every active case in every project — nested per project, with screenshots — plus a workspace.json roster of members, roles, projects, and suites, as re-importable ZIP parts. Confirm each part has finished downloading before the next one starts.
Require SSO or a passkey for a workspace
By default, anyone on your team can reach the workspace however they signed in — magic link, passkey, Google, or Microsoft. Owners can raise that bar from Workspaces → Manage → Members → Access. Choose Passkey or SSO only to rule out magic links, or SSO only to require Google or Microsoft sign-in. The setting applies to that workspace alone; personal projects are never affected.
Session lifetime. On the same screen, owners can cap how long any member stays signed in — 8 hours, 24 hours, 7 days, or the 30-day default. This is an account-level limit: it applies to every member's session (including the owner's), and tightening it signs out sessions that are already older than the new limit. Next to each member, Sign out everywhere ends every session on that account at once — the lost-laptop and offboarding control. The member keeps their seat and can sign back in.
The change takes effect immediately. Members whose current session used a weaker method are asked to sign in again the next time they open the workspace — they keep their account and their personal work either way, they just cannot reach workspace data until they sign in a qualifying way.
You cannot set a policy your own session would fail. If you are on a magic link and try to require SSO, TestDossier refuses the change rather than locking you out of your own workspace — sign in the stronger way first, then set it.
Use Export access review on the same screen to download a CSV of who can reach the workspace, at what role, how recently they were active, and which sign-in method their current session used. That is the list most security questionnaires and quarterly access reviews ask for, and it shows you who would be affected before you tighten the policy.
Devices — where you're signed in
Your account can be signed in on up to three browsers at once; signing in on a fourth signs out the oldest. Select the account button at the bottom left, then open Devices. Each entry shows a coarse browser-and-OS label plus when it was added and last active. Remove signs that browser out immediately.
Sign in with Google or Microsoft
Prefer not to wait for a magic link? Choose Continue with Google or Continue with Microsoft on the sign-in screen. TestDossier receives only your verified email address from the identity provider — no profile data or credentials — and links it to your existing account (or creates one on first sign-in). All methods reach the same account, so you can use any of them at any time.
Microsoft work accounts. Entra ID only counts an email as verified when your tenant asserts it (the email_verified or xms_edov claim). If your sign-in is refused, ask your Microsoft 365 administrator to enable the optional xms_edov claim for the TestDossier app registration, or use email or a passkey instead.
Sign in with a passkey
Passkeys are available to every signed-up TestDossier user. Sign in with an email link or Google account, select the account button at the bottom left, open Security, and choose Add a passkey. Your browser will ask for your fingerprint, face, device PIN, or security key.
After enrollment, choose Continue with a passkey on the sign-in screen. A passkey is tied to the TestDossier domain, resists phishing, and does not send a reusable password or private key to TestDossier. Synced passkeys may follow your Apple, Google, or Microsoft account; device-bound security keys remain on that device.
Author and organize
Open test cases
Work on multiple test cases in parallel. Select + to create a test case and × to close it in the editor. Closing a test case that has content does not delete it: open Projects, select the project, and find it in the Cases list. An empty new case closes without a prompt.
Tags
Every test case carries a tags field (the + tag chip area at the top of the case form). Tags are workspace-shared and free-form — typical use is "smoke", "regression", "payments", "nightly". Press Enter / , / Space to commit a tag, or click outside the input. Click the × on a chip to remove.
Filter by tag: open Projects, pick a project, and use the tag chips above its case list. Each chip shows how many cases carry that tag; select several to narrow the list to cases carrying all of them. The same filter narrows the open-case strip, where active tags appear as pills you can remove with ×.
Bulk actions in a project
Open Projects, select a project, then use the checkboxes in its Cases list. The selection toolbar offers the actions that apply to the selected cases:
- Close N open test cases — close the selected test cases in the editor without deleting them (same as selecting × above the editor).
- Delete N — move selected closed cases to Recently Deleted for 30 days.
- Move — move cases to a suite, another project, or an available workspace.
- Open in editor — open the selected saved test cases for editing.
- Select all matching — extend the selection beyond the current page when search results are paginated.
A single "N selected" chip at the start of the toolbar carries the count so action labels stay short. Hidden when nothing is checked.
Test Case ID (TD-xxxxxxxx)
Every test case gets an auto-generated, stable ID that appears at the top of the form once you start filling it in. It's read-only — the app generates it once and it never changes. Use it to refer to a specific test case in Slack, Jira comments, or anywhere else. Click the copy icon next to the ID to copy.
Why it matters: two test cases for the same ticket (e.g. happy path vs. error path) can be told apart by their Test Case IDs even though they share the ticket key. The ID is also embedded in every export (ZIP filenames, CSV/XLSX columns, README) so re-imports preserve the link to the original.
Sharing with teammates: when you export a backup and a teammate restores it, they see the same TD-xxxxxxxx you do. Both of you can refer to the case by its ID and mean the same thing. Only on the rare event of a true ID collision in their workspace will the import be renamed (with a notice).
Limit: the ID identifies a logical test case, not a version of it. If both you and a teammate edit the same case independently and re-share, you'll have two diverged copies with the same ID — there's no built-in merge resolution. For ongoing collaborative editing, use a QA Team workspace, where shared cloud data is the workspace source of truth.
Autosave
Changes autosave after a short delay. Anonymous and Free projects save to this browser's IndexedDB; QA Pro projects and QA Team workspaces sync to the cloud while keeping a local working cache. The top-bar indicator shows when the current change is saved or if saving failed.
Capture evidence
Screenshots + image annotation
Paste with Ctrl/⌘+V, drag files, or select the dropzone. Images compress automatically to keep cases small. Select an image to view it at full size, or select its edit icon to annotate it.
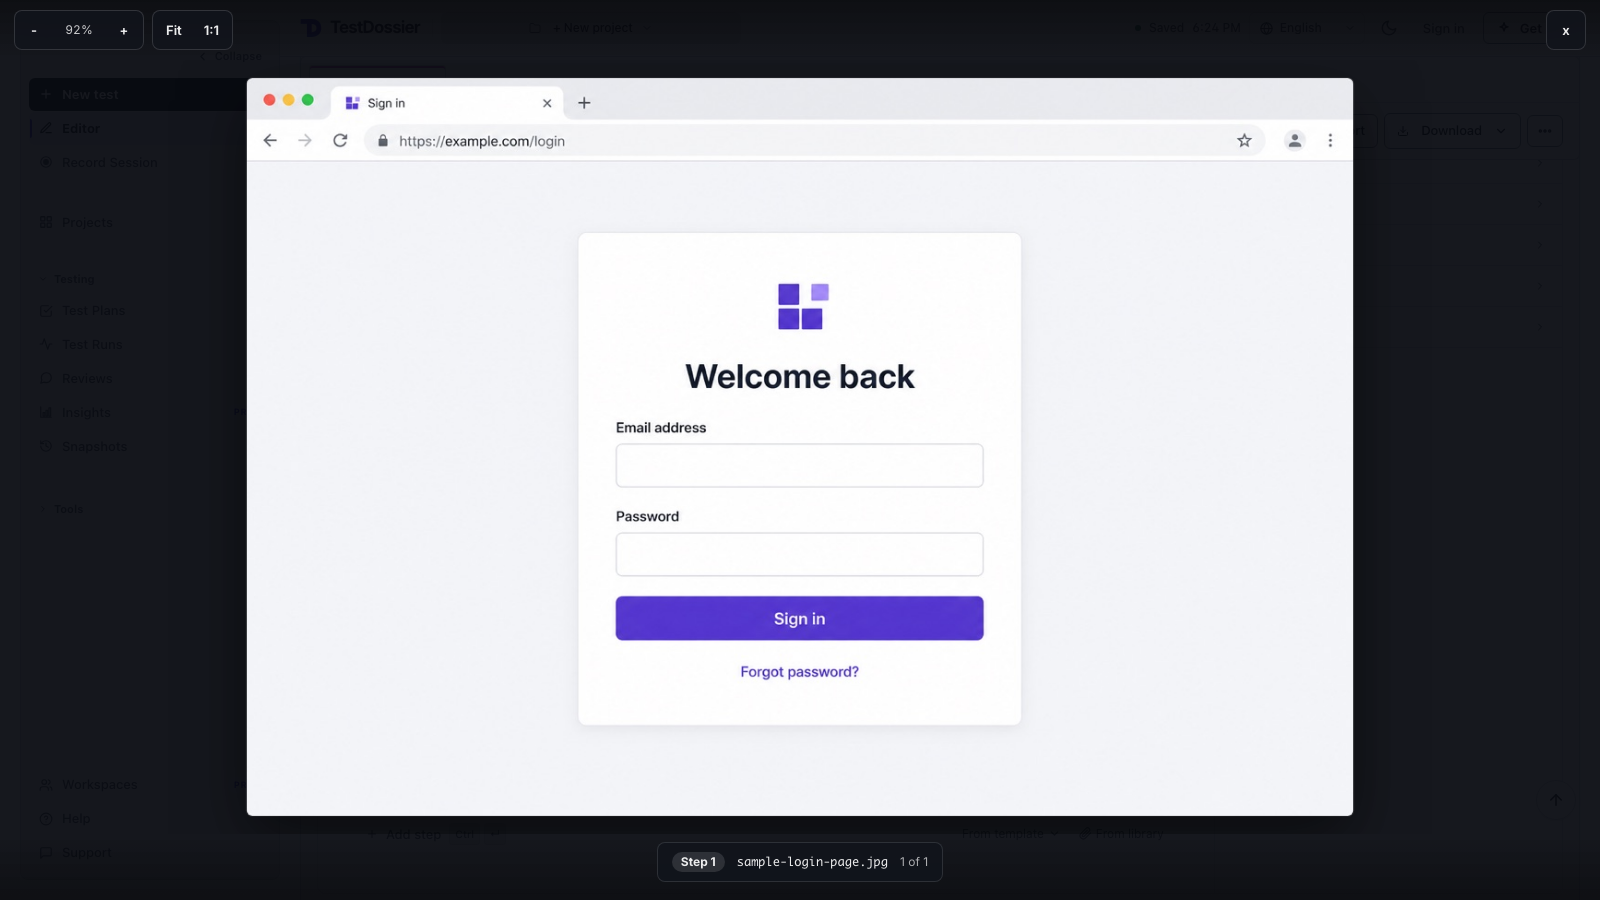
Annotation toolset:
- Rectangle / arrow — drag on the canvas to draw. Stroke color follows the selected color swatch.
- Redact — drag a rectangle to burn in a solid black mask. Use it for PII (emails, names, customer IDs) before sharing a screenshot externally. Redaction is destructive — the underlying pixels are replaced, so re-opening the image won't reveal what was masked.
- Undo / Clear — Undo removes the latest annotation; Clear returns the working canvas to the image as it was when the editor opened. Changes are committed only when you select Save.
- Zoom — zoom the canvas in or out (25%–400%) while annotating. Drawing stays accurate at any zoom, and zoom never changes the saved image.
- Save — replaces the step's working image with the annotated copy. Local projects keep it in this browser; cloud projects upload the saved copy to cloud evidence storage.
After you save, annotations replace that image. To retain an unannotated copy, use the ⎘ action to copy the image to another step before editing it.
Evidence column (exports)
The compact table format used in Jira / Markdown exports carries an Evidence column for a step's screenshots. The column is omitted when no step in the test case has evidence, so empty cases do not render a blank column. In CSV / XLSX exports, the same column lists folder-prefixed paths (screenshots/img.png) so the destination tool's importer—or a person browsing the unzipped files—can find every artifact.
Step templates
+ From Template offers pre-shaped steps (Login, Form submission, API call, Navigation, Permission check, Error handling). Some pre-fill the Test Data field with useful placeholders.
Test data at two levels
Shared test data (environment config, test users) goes in the Specification group's Test Data field. Step-specific data goes in each step's Test Data field. Both support key: value lines — keys get auto-bolded in the output.
Output formats
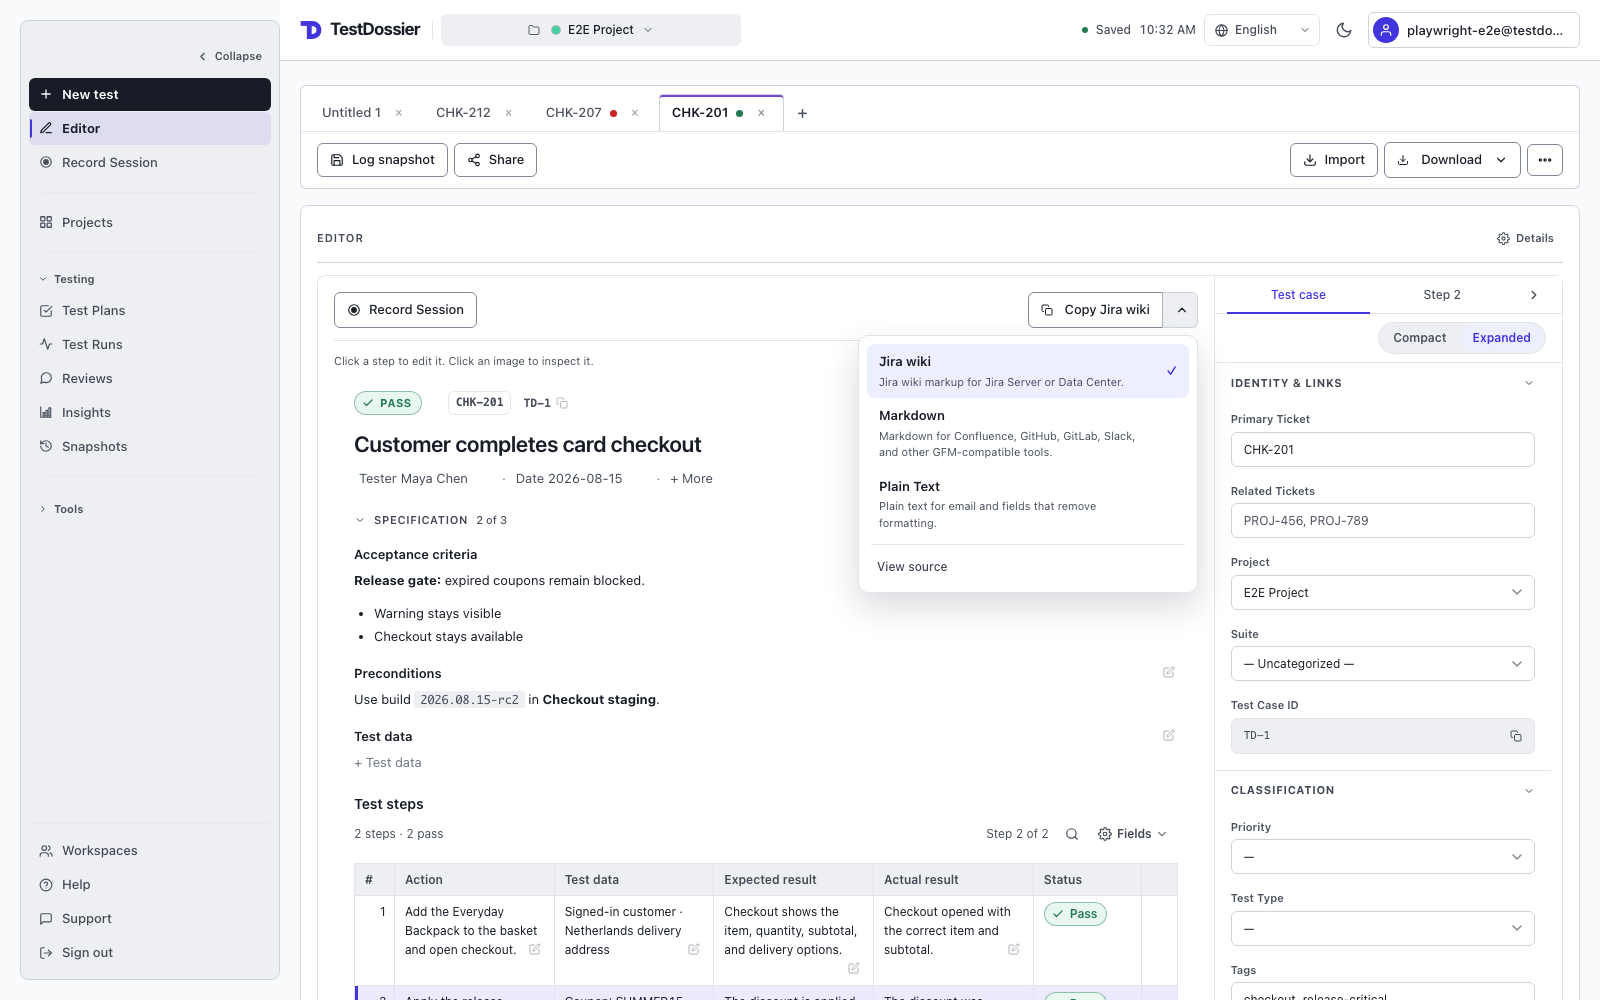
Three preview tabs: Jira wiki for Jira Server/Data Center and compatible legacy fields; Markdown for GitHub and other Markdown-aware tools; and Preview for rendered HTML. Confluence support depends on the editor or import method, so verify pasted formatting before publishing.
Compact step view
The Compact button in the Test Steps toolbar controls how step rows appear in the editor:
- Expanded is the default. Every step's fields remain visible.
- Compact keeps only the active step expanded, making long cases easier to scan. Select Expand All to return to the expanded view.
The choice is stored for each open test case and is off by default, including for imported cases. It changes the editor only; Jira, Markdown, and Preview exports keep their selected output format.
Defect details for failing steps
When you set a step's result to FAIL or BLOCKED, a Defect Details field appears below. Use it to describe what went wrong — error messages, reproduction conditions, timing, console logs, suspected cause. Click Copy as Bug Ticket to copy a pre-shaped bug ticket body (Summary, Steps to Reproduce, Expected, Actual, Environment) that you can paste directly into a new issue.
By default, Steps to Reproduce includes only the failed step itself — most bugs are self-contained ("clicking submit returns 500") and prior steps would be noise. When the failure depends on context (e.g., "after navigating through 3 pages, the form clears"), tick Prior steps as repro path in the dropdown — the body then includes every PASS/FAIL step before the failure as a numbered chain, with the failed step bolded and annotated "← failed here". Skipped steps are omitted (intentionally bypassed); blocked prior steps are omitted (didn't run). Like the format choice, this toggle persists for the session.
The format dropdown (▾) beside a step's bug-handoff button chooses Markdown (GitHub, GitLab, Linear, Notion, Jira Cloud), Jira wiki (Jira Server / Data Center), or Plain text. It starts with Jira when the Preview copy action is set to Jira; otherwise it starts with Markdown. Choosing a different format here applies to later steps in the same editing session. Closing the test case clears that step-handoff override.
If the step has screenshots, a Download screenshots button bundles just this step's images into a small zip — drag the files into the bug tracker after pasting the body.
Lightweight formatting
In any textarea you can use four Markdown-style shortcuts:
**bold**→ emphasis in the output\`code\`→ inline code (good for error messages, IDs, API paths)- Lines starting with
-or*→ bullet list - Lines starting with
1.,2., etc. → numbered list (renumbered automatically)
These render properly in Jira wiki markup, Markdown, and the rendered preview. In TestRail/PractiTest CSV exports they stay as literal characters (readable but not styled, since those tools import as plain text).
Note: Lists only render as proper lists in block fields (Summary, Preconditions, Defect Details, etc.) and not inside the per-step Expected/Actual table cells — Jira's table cells don't support list markup. In those cells they display as bulleted/numbered lines, which is still readable.
Details rail sections
The Details rail beside the document holds Identity & links, Classification, Run / execution, Specification, and Notes. Select a step row and the rail switches to that step's fields. Compact shows one section at a time; Expanded opens them all. The case rail and the step rail each remember their own.
Reopening a closed test case
Closing a test case in the editor keeps it in the project. Open Projects, select the project, and find the test case in its Cases list. Select the row and choose Open in editor, or open the row directly. Deleting a test case is a separate action; deleted cases remain recoverable from Recently Deleted for 30 days.
Recently Deleted
Deleted test cases and runs stay recoverable for 30 days. Expand Tools in the sidebar and select Recently Deleted. You can restore one item, restore a selection, or permanently delete items you no longer need.
- Free and anonymous local projects: recovery is stored in this browser. Clearing browser data also clears this local bin.
- QA Pro and QA Team cloud projects: recovery is stored with the project and follows your account across devices.
- Safety: Delete permanently and Empty bin require confirmation and cannot be undone.
Projects
Projects group test cases by client, app, or sprint. Select the current project name in the top bar to switch or create a project. Select Projects in the sidebar to browse and manage a project's suites and Cases list.
- Free / anonymous: unlimited local projects. They live in this browser only — a "Local" pill marks each in the switcher. Upgrade to Pro to sync them across all your devices.
- QA Pro: unlimited cloud-synced personal projects. They appear on every device you sign in to.
- QA Team: projects created in the workspace are visible to its members.
To archive a project, select the current project name in the top bar, find the project, and use the × action on its row. Archived projects appear in the menu's collapsed Archived section, where they can be restored or permanently deleted.
Upgrading from Free to QA Pro: a prompt offers to migrate local projects to cloud storage. The migration includes suites, open and closed cases, plans, test runs, snapshots, and Recently Deleted items. The local project is removed only after its cloud copy is verified. You can skip the prompt and migrate later from the project switcher.
Tracker URL templates
Turn raw ticket IDs (the Primary Ticket field on a case, Linked Tickets chips, step defect notes) into clickable links to your Jira / Linear / GitHub issue tracker. Set a template like https://yourorg.atlassian.net/browse/{id} and every PROJ-123 rendered anywhere in the case becomes a one-click navigation to its tracker.
Two precedence levels, so global defaults coexist with per-project overrides:
- User global — applies to every project you can access. Expand Tools, select Tracker URLs, and use the global field at the top.
- Project override — set on a specific project when its tickets live somewhere different from the rest of your work (e.g. one client uses Linear instead of Jira). Falls back to the global when blank.
Templates support {id} and {ticket} as the placeholder. A malformed template (no placeholder) renders the ticket as plain text rather than breaking the link — soft-fail by design.
Step Library
Save a step once, reuse it across many test cases. Common use: "Sign in as admin user", "Reset the seed data", recurring assertions.
Anonymous: saved steps stay in this browser. Free and Pro: saved steps sync with your account. In a workspace, the library is shared with workspace members.
- Save: click the 📎 icon in any step's action bar — the step's action / expected / test data become a library entry.
- Insert: click 📎 From Library next to + Add Step and pick. The inserted step is linked back to the library entry (visible as a "Library: name" pill on the step header).
- Propagation: when you edit the canonical library entry, every linked step updates on next render. Editing a linked step's fields locally detaches it from the library.
- Manage: sidebar Tools → Step Library. Search, edit, archive.
Browser capture
Record a session → test steps
The Record a session button bridges to the TestDossier Capture browser extension — recording happens in the extension's side panel, not in the app (a browser can't open an extension panel for you). If it's installed, the button shows how to open the panel; if not, it points you to install it.
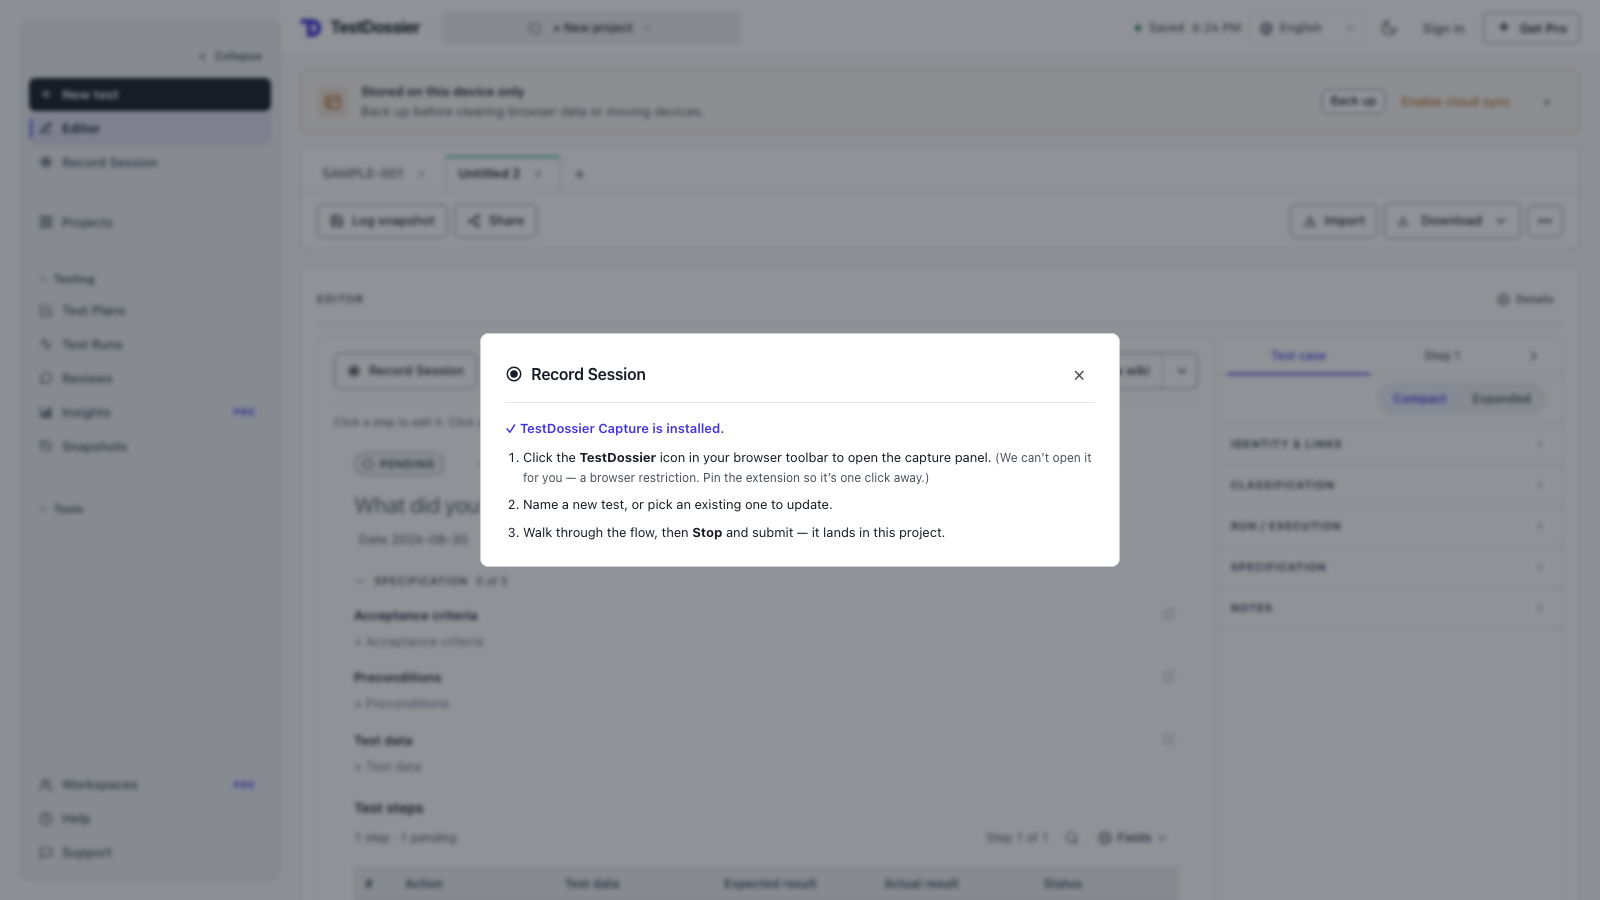
- What it can capture — clicks and double-clicks, links and page download/export requests, right-clicks, committed text/rich-text and native date/time/color/range edits, selects, checkboxes/radios, file selection and file drop, form submission, special keys and shortcuts, navigation (including reload, back/forward, and tab changes), hover-revealed menus and tooltips, mouse/pen drag and touch swipe gestures, dialogs, and short visible results such as status messages, validation feedback, and headings. Settled and manual screenshots are best-effort. When Network & errors is enabled and available, supported network and GraphQL metadata plus console warnings and errors, uncaught exceptions, and unhandled promise rejections can attach as evidence. Available fetch/XHR previews are optional, capped, and redacted; redaction is not a complete secret scanner. The step conversion is deterministic: a captured event stream becomes readable steps with no model call and no AI involved.
- What you do — open the panel, optionally name a new test (or search/paste a
TD-…id to update an existing one), walk through the flow, then Stop. Capture generates a title, readable Action / Data / Expected / Actual fields, and screenshot evidence for review. Confirm the journey once—or mark an individual issue—then submit. - What it does NOT decide — generated Expected text is a review suggestion, not an automatic verdict. Recorded steps stay PENDING until you confirm them; a captured non-2xx response or page error is highlighted but never pre-judged, because an error can be the intended result of a negative test. A checkpoint you explicitly add with Assert remains authoritative.
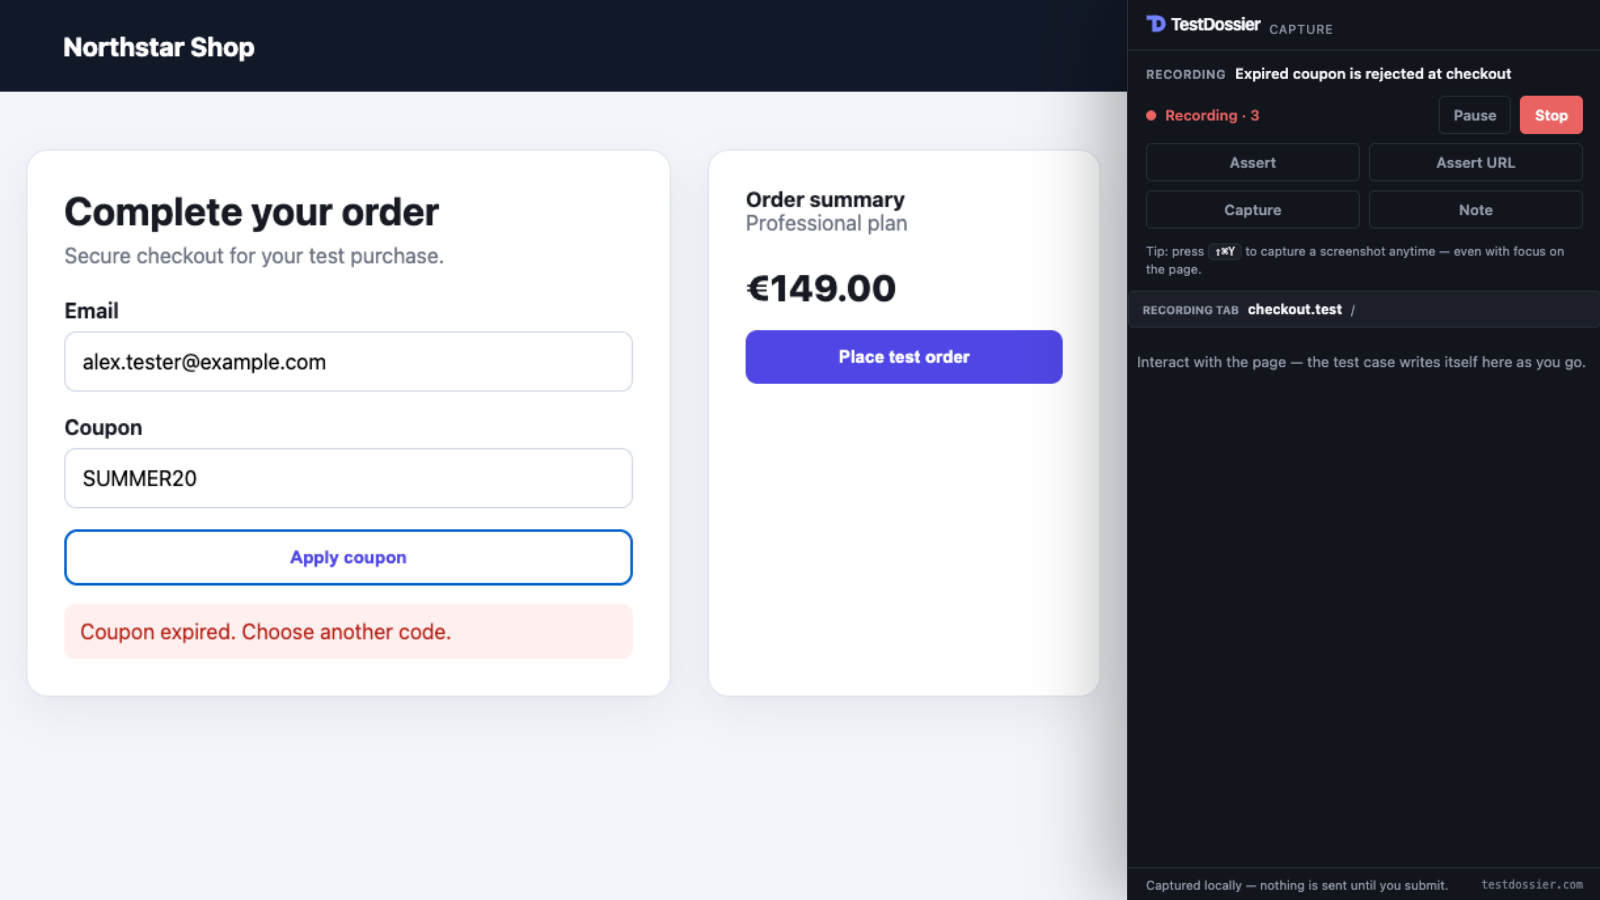
Recording stops when you click Stop in the panel. The captured session stays on your device until you submit.
- Watch the case write itself — while you record, the panel shows the assembled test steps forming live (the same deterministic projection the submit uses), not a raw event log. What you see mid-recording is what the case will say.
- Automatic title — a title you type always wins. Otherwise Capture ranks the recorded actions for likely business intent, combines the strongest one with the strongest visible outcome (for example, Log in and open dashboard), then falls back to a cleaned tab title or site name. Setup hovers and right-clicks do not outrank the action that produced the result. Field values, email addresses, token-like text, long identifiers, and query strings are excluded. The generated title remains editable after Stop.
- Near-zero documentation — after Stop, choose Everything behaved as expected to confirm the generated journey in one click. If one step did not behave correctly, choose Mark issue there and confirm the remaining steps. Submit unlocks only when every generated step has a human decision.
- Share a finding in one step — after Stop, Submit & copy share link submits the capture and mints a public share link of it, copied to your clipboard — paste it to a developer and they see the exact steps, screenshots and observed errors. When the session caught a failure, the button reads Share finding and the share page leads with the failing step (what broke, where, plus your browser/OS — filled in automatically). Free share-link limits apply; available for new captures (not re-records).
- Replay a test — pick an existing test and let the extension walk you through it step by step while you record Pass, Fail, Blocked, or Skip with evidence. Submitting preserves the Replay result without changing the maintained steps or adding a row to Snapshots. Use Log snapshot in the app when the result should become a deliberate checkpoint.
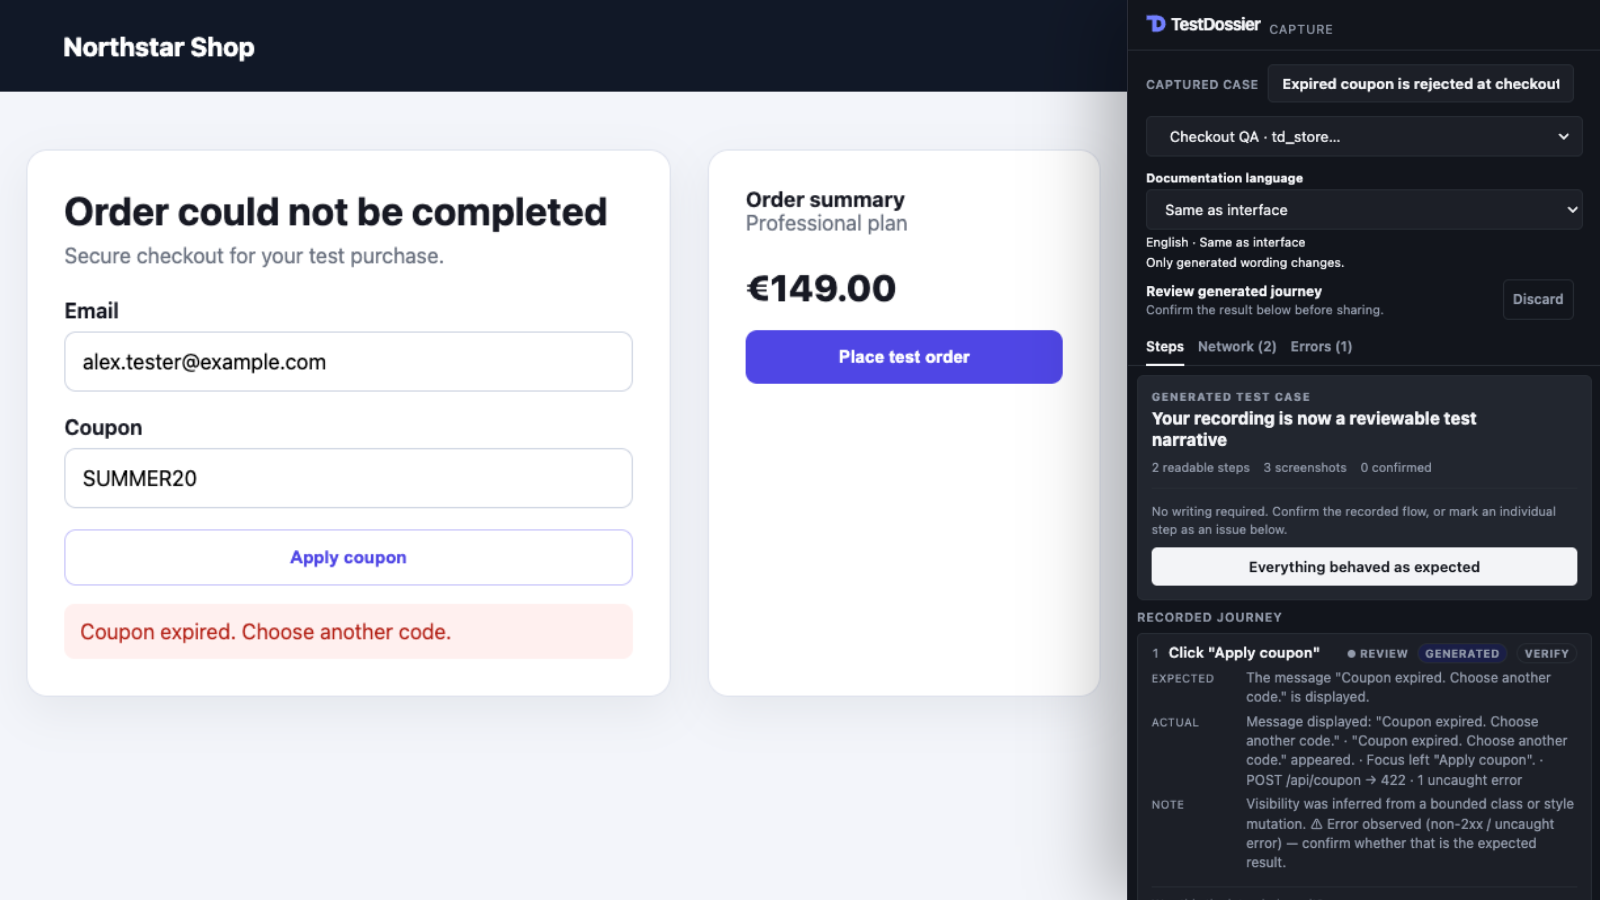
Free vs Pro. Free includes unlimited local capture. Captured screenshots stay on your device: the server holds the bundle just long enough for the app to drain it into your local store on next open, then deletes it (7-day TTL). If too many captures are waiting undrained, open the app to save them before recording more. Pro adds cloud-synced evidence and the extension's CI sibling for pipeline runs.
File uploads. Selecting or dropping files produces an action such as Attach a file to "Documents", with invoice.pdf kept separately as test Data. Capture records only bounded, redacted base filenames—never the file bytes and never a local path. It keeps at most five names plus a remaining-file count; a sensitive file field is masked entirely. The tested website still receives the file normally; TestDossier does not intercept or copy it.
File downloads. A page link with a download filename, a direct file link, or a control labelled Download / Export becomes a step such as Download "report.csv". The link-provided name is bounded and redacted; downloaded bytes are never read. Without broad permission to manage browser downloads, Capture honestly records the download was requested and expects it to start—it does not claim browser/OS completion. If the page displays its own success message, that visible result is included.
Coverage boundary. Ordinary page interactions are covered, including controls inside frames and common shadow-DOM paths. Scrolling is used to settle and frame screenshots rather than becoming noisy standalone test steps. Browser chrome and operating-system UI—such as the native file picker, permission prompts, downloads shelf, save dialog, or a browser's own menus—cannot be inspected as page DOM; the surrounding page action/result and screenshots are captured where the browser permits it.
Capture screenshots — Auto vs Manual
Before you hit Record, the panel lets you choose how screenshots are taken for the session. The setting is per-recording (it sticks across sessions) and shows under Screenshots.
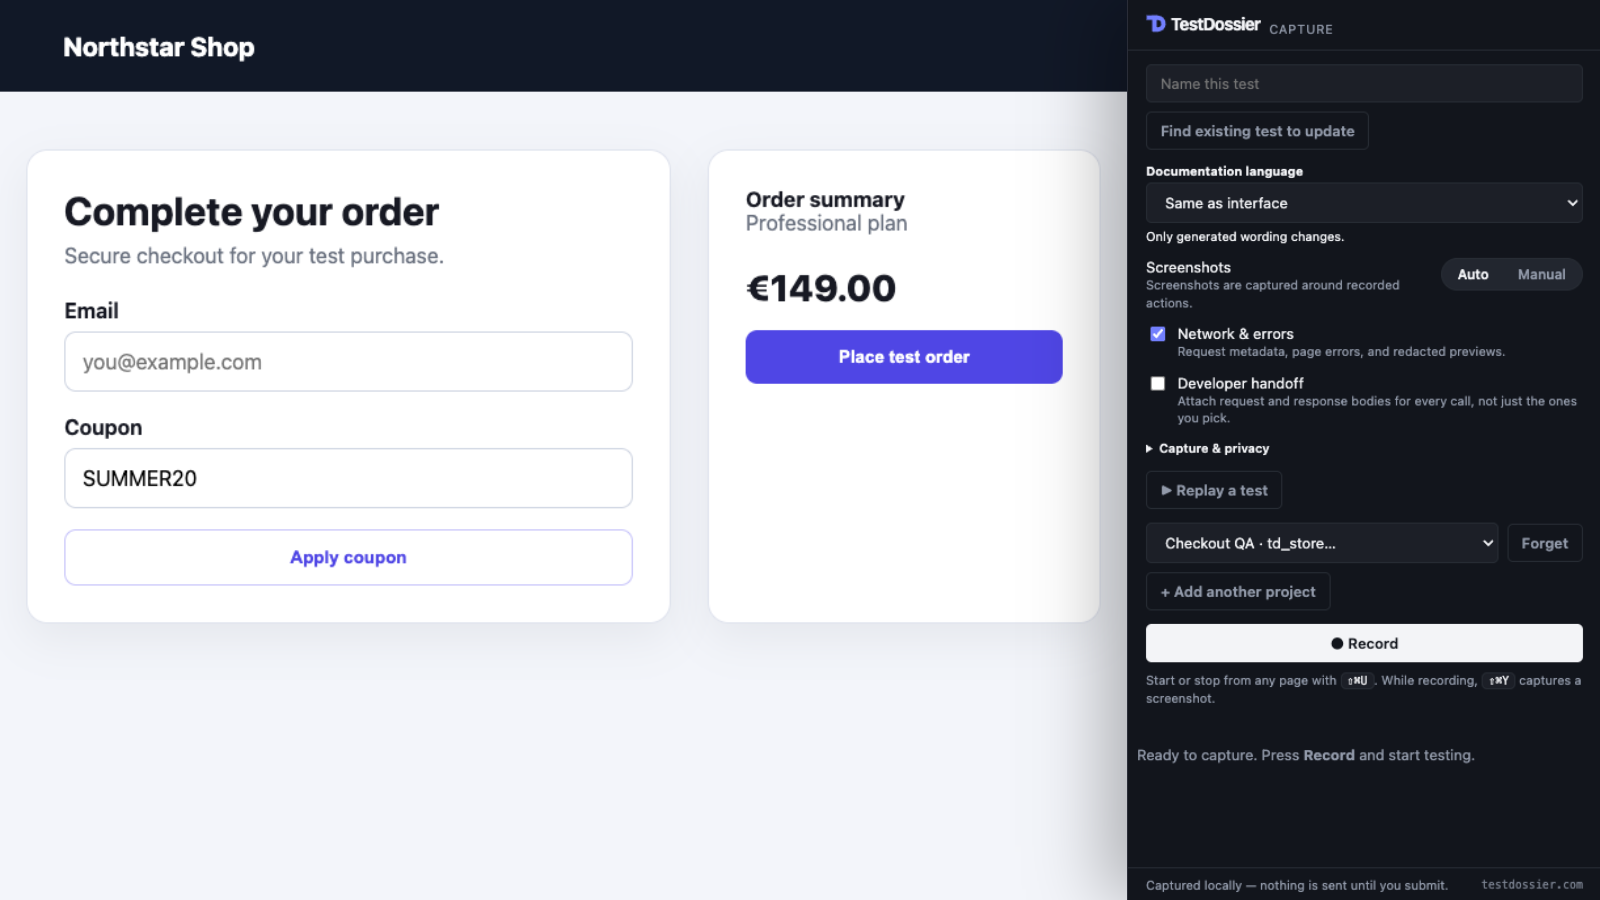
- Auto (default) — a keyframe is captured for you once the page settles after each action: it waits out the network, and any scrolling, so the shot shows the result of the step (the landed, rendered page) rather than the instant you clicked.
- Manual — nothing is captured automatically. You take every frame yourself with Capture, so the evidence is exactly the moments you chose and nothing else. The recording header reads "Manual capture" so the mode is clear.
The Capture button is available while recording in both modes, and there's a keyboard shortcut for it (default Ctrl/Cmd+Shift+Y, rebindable at chrome://extensions/shortcuts) that works even while your focus is on the page — handy for grabbing a transient state, like a success toast, that an automatic shot might miss.
- In Auto — Capture adds a frame to the current step alongside the automatic one; it never replaces it, so you don't lose the settled-page shot.
- In Manual — Capture is the only way a frame is taken.
What the extension redacts (and what it can't)
The captured session is buffered locally and is not sent until you press Submit, but a captured case can be shared publicly — so the extension redacts on the way in, not just on the way out.
- Password fields — never captured. Any
<input type="password">value is masked before it enters the buffer. - Known-sensitive values — fields whose name, id, or autocomplete attribute matches password / token / secret / OTP / CVV / card / SSN / PIN are masked too. This covers
<input>(including file inputs),<textarea>, selects, and rich-text (contenteditable) fields. - Visible result prose — after an action, Capture can promote up to three short status, validation, or heading changes into Actual / Expected text. Common email, token, and long-number patterns are redacted and the text is length-bounded, but review it like any other page content.
- Network evidence is best-effort. For supported requests observed while Network & errors is available, Capture can retain the method, sanitized URL, status or error, resource type, and timing when available. Supported GraphQL POST requests can add operation metadata. In standard mode, an available fetch/XHR body preview is included only when you choose Attach; Developer handoff can automatically attach available previews for supported calls. Previews are subject to per-preview and session caps and are redacted in the page, then redacted and clamped again on submit. Redaction is a safety net, not a complete secret scanner. Cookie and authorization header values are not collected from browser traffic.
- Site access is opt-in — the extension installs with access to only the TestDossier origin. When you first press Record, the browser asks you to allow access to the sites you test (its screenshot API requires this one grant), and you can withdraw it from the extension's details page. Nothing is captured outside a recording you started.
Screenshots still need review. Before storing a screenshot, Capture makes a best-effort, capped attempt to mask detected sensitive-field regions. Detection or compositing can miss or fail, and other rendered content—account names, customer data, or an open chat panel—can still appear. After recording, you can black out any screenshot before submitting. Use Pause before doing anything off-record and review every screenshot before submitting.
Redact before you submit. In the stopped preview, open any screenshot and choose Redact — drag black boxes over anything private, then Apply. The boxes are burned into the frame (the original pixels are replaced, not overlaid), so what you submit is what a reviewer can ever see.
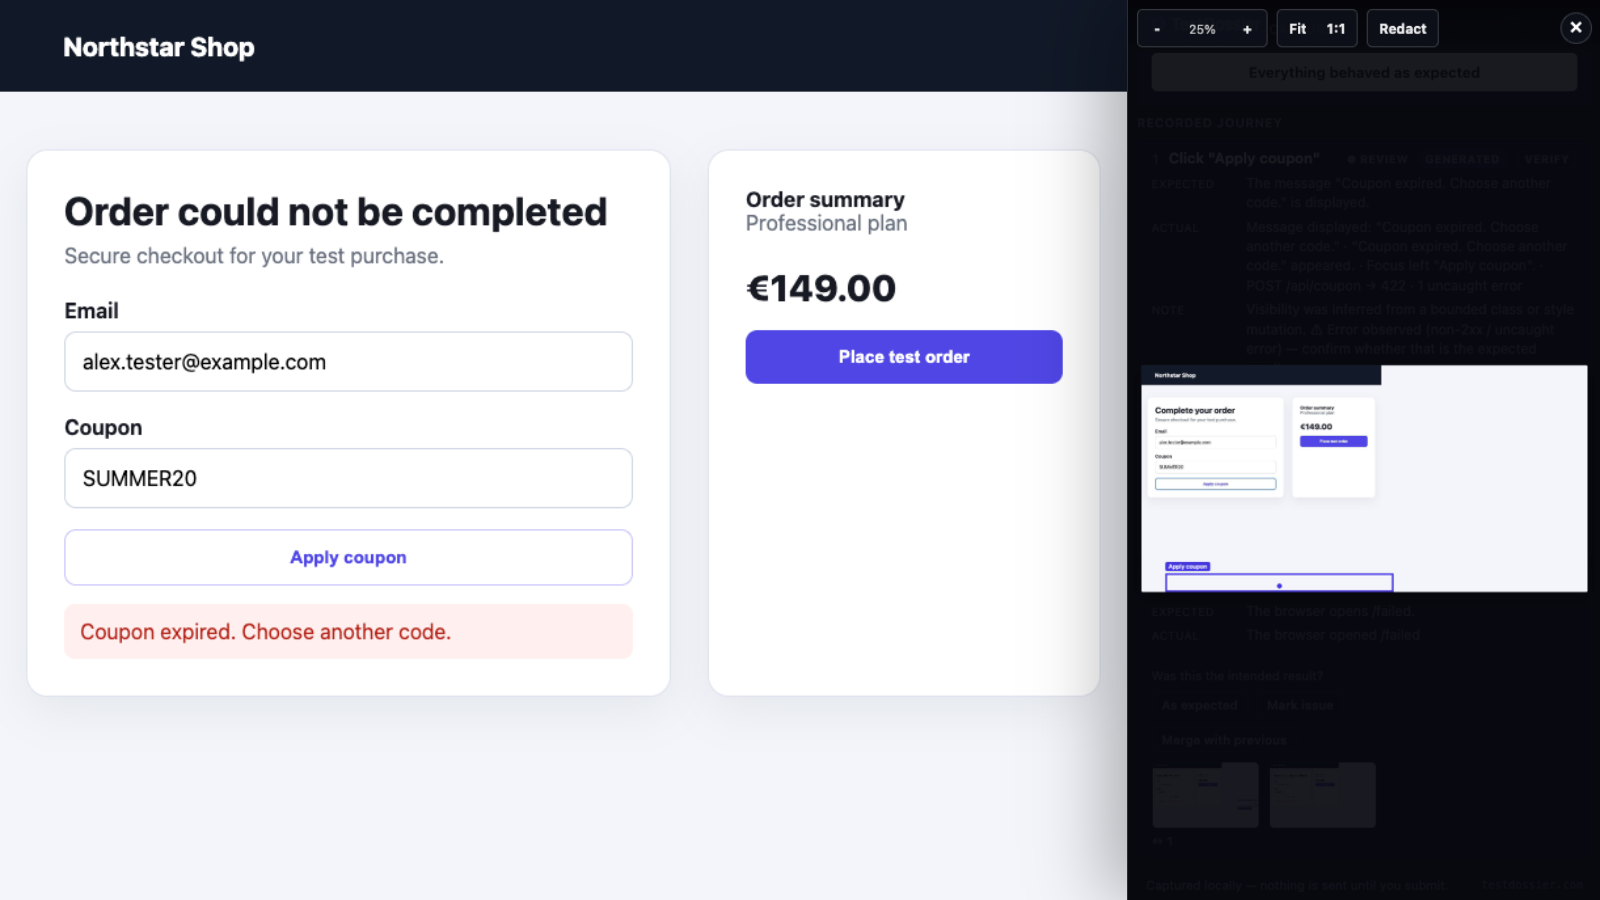
"Network/error capture unavailable" warning
If you start a recording with Network & errors on but see "Network/error capture unavailable on this tab", the extension could not register one or more network listeners for that tab at recording start. This warning reports that registration failure only; it does not identify the cause.
The recording continues—DOM actions and screenshot capture are still attempted. This warning proves only that the network listeners were not registered; page warnings or errors may still be captured when the separate page hook is available. The submitted draft carries a one-line note marking the network-evidence gap.
To retry network capture, move to a normal page where the extension has site access, reload if needed, and start a new recording. If the notice returns, treat network evidence as unavailable for that recording.
Plan, run, and automate
Suites
Suites are folder-style groupings of test cases inside a single project. Useful when a project has 40+ cases and you want them sliced by feature area (Auth / Checkout / Admin) or by what you re-run together (Smoke / Regression / Nightly). Each test case lives in at most one suite; "Uncategorized" is the bucket for cases without one.
- Create: open Projects, select a project, then choose + New Suite in the Suites column.
- Move cases: select rows in the project's Cases list, open Move, and choose a suite. You can also create a suite from that menu.
- Filter by suite: select a suite in the left column. Select All cases to show every case in the project.
- Plan integration: Test Plans render their items grouped by suite, with a "common setup" note per suite that stays with the reusable plan. A Smoke suite's setup ("seed admin user, clear cache") shows once at the top of its section in every plan run.
Suites round-trip via the bundled export presets — the TestRail Section column reads from the suite name, so a suite-organized project lands in TestRail with the same folder shape.
Test Runs
A Test Run is a multi-case execution session — pick the cases you want to run for a build, work through them, and the run tracks which ones have been executed, which are still pending, and what each one's latest result is. Different from a Test Plan (the static list of cases that should be in this regression suite) and from Snapshots (the per-case execution records). A run is the session; the snapshots it produces are the evidence trail. Open from sidebar Testing → Test Runs.
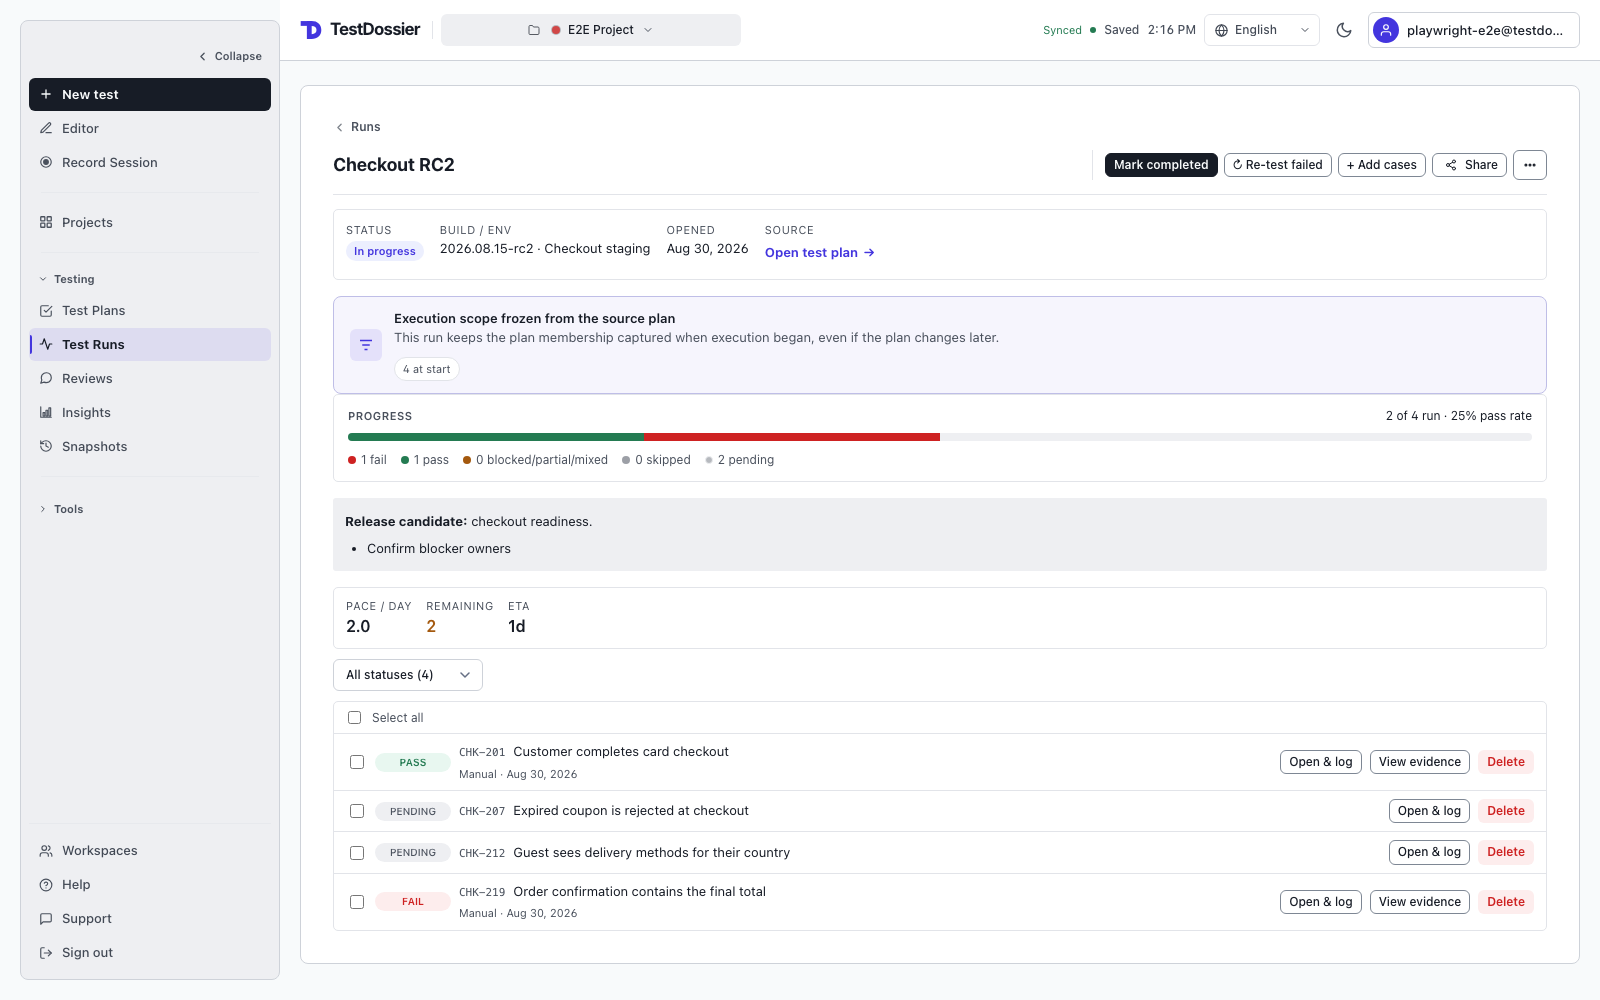
Lifecycle (intentional friction so "closed" feels final):
- Open — fresh run, cases assigned, nothing run yet. Click Start running to move on.
- In progress — actively executing. Logging a snapshot against a case in this run updates the run's per-case latest result. Click Mark completed when finished.
- Completed — execution done; case scope and results are sealed. Reopen if you need to add/remove cases or log more evidence. Click Close run when the record has also been reviewed or handed off.
- Closed — read-only seal. Useful when you've sent the results to a stakeholder and want the record locked. Reopen moves it back to In progress if you need to amend.
Runs created from plans keep a frozen starting scope. Later plan edits do not silently rewrite a run that is already underway. When adding cases to a linked run, choose run only (the default) or explicitly add them to both the run and its source plan. Removing a case from the run never removes it from the reusable plan. The run highlights every difference from its starting scope for review.
Re-test failed: when a completed (or closed) run has any FAIL / BLOCKED cases, a ↻ Re-test failed button creates a new run pre-seeded with just those cases. The new run inherits the original's name with a "Re-test:" prefix. Cuts the regression loop down to one click instead of hand-picking cases.
Filters: the runs list supports search by name, a status filter (All / Open / In progress / Completed / Closed), and a Build filter. Your filter state remains when you leave and return to Test Runs.
Test plans
Group test cases into a sprint regression or release checklist. Plans define scope; Test Runs capture the build, environment, assignee, status, and execution results. Open from sidebar Testing → Test Plans.
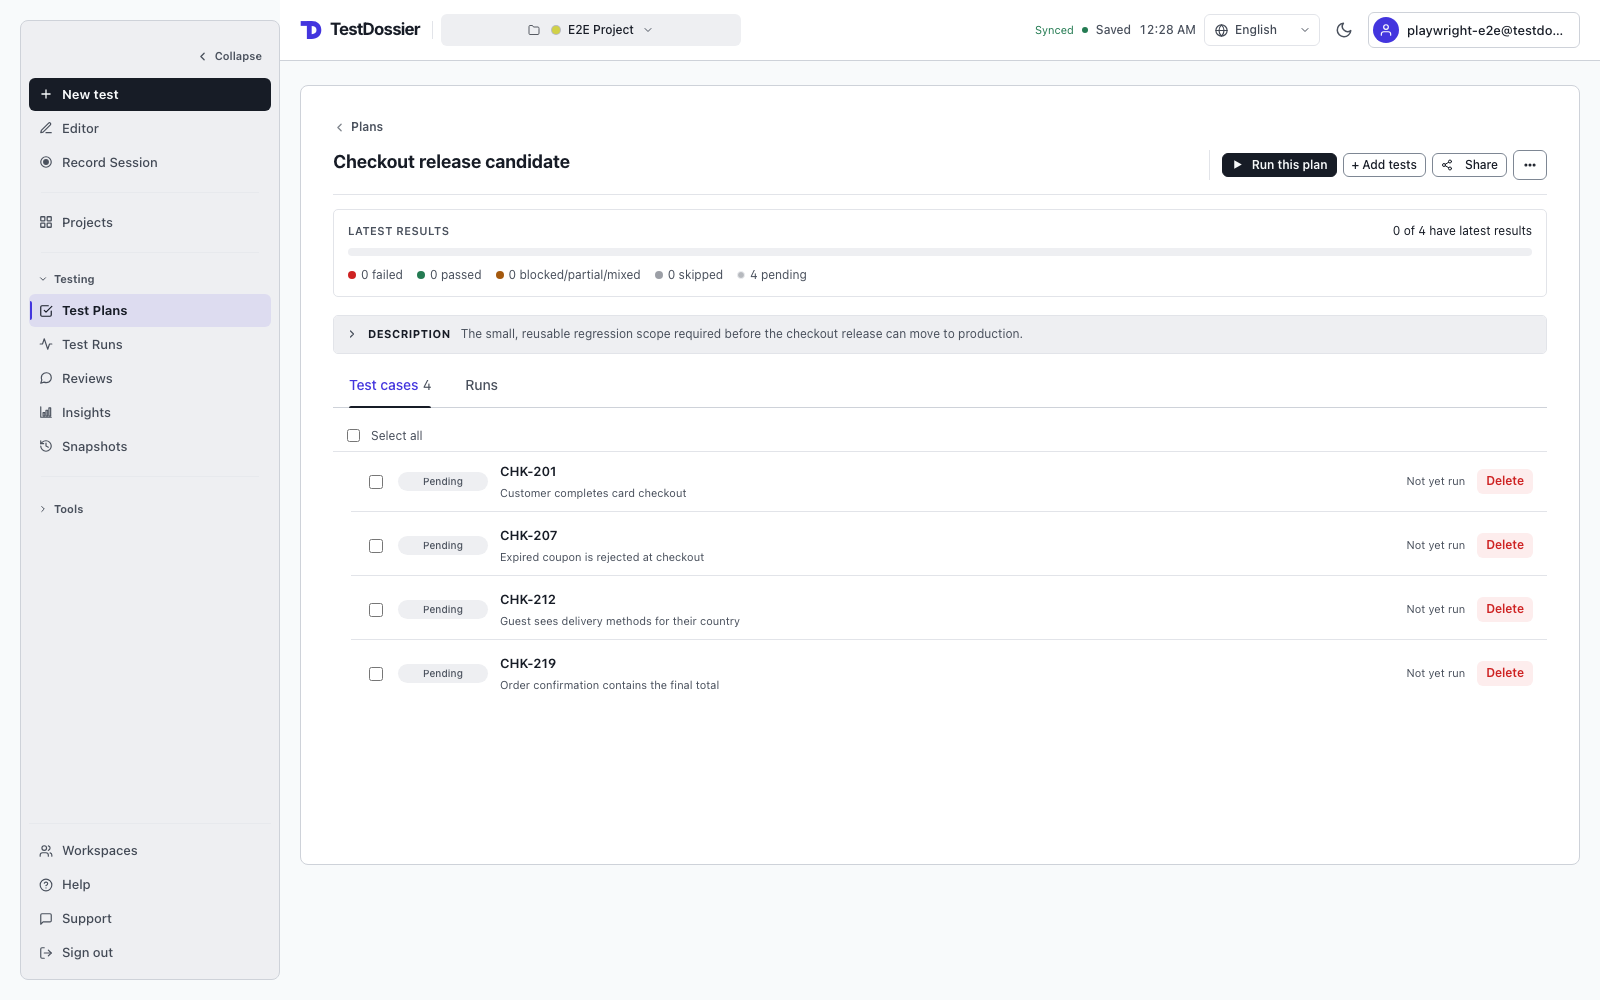
Free gets unlimited plans inside its local-only projects (stored in this browser, alongside the local projects themselves). Pro adds personal cloud sync; QA Team adds workspace sharing. Workspace plans require that workspace's own active QA Team trial or subscription, regardless of each member's personal plan.
Common pattern: keep one "Sprint regression" plan as the canonical checklist, then click Run this plan whenever you need a new execution for a build or environment.
Plan results vs dashboard results — they can disagree on the same day. A plan row uses latest-run-wins ("did we get this case green for the release?"); the dashboards (Insights, Hotspots) use any-fail-in-day ("is anything broken on this case today?"). If a chain failed at 03:00 and a tester verified PASS at 14:00, the plan shows PASS (sign-off achieved) and the dashboard shows FAIL (something flaked earlier). Both true; intentional split, not a bug.
Test Inbox
A disposable email address that delivers right inside the app. Drop it into a signup form, password reset, or magic-link flow — messages arrive within seconds. Open from sidebar Tools → Test Inbox.
- Personal inbox (Pro): pick a prefix like
testerand you gettester.<random-token>@inbox.testdossier.com. Random suffix prevents enumeration; the prefix is shown in the UI. - Workspace inbox (workspace owner): a single shared address visible to all workspace members. Useful for testing flows the whole team needs to verify.
- Rotate: change the prefix or suffix any time — old mail to the previous address bounces, past messages stay readable.
- TTL: messages auto-delete after 7 days.
Test Type field
Every case carries an optional Test Type. The label is yours — picked from a dropdown of conventional categories, used by exports (TestRail / PractiTest Type column, JUnit <property name="test-type">) and by Insights to slice runs by category.
- Smoke — quick happy-path proof that the build loads end-to-end.
- Functional — does the feature work as specified. The workhorse type for most cases.
- Regression — covers a specific change plus the adjacent surfaces that often break with it.
- End-to-End — full user journey across services / pages. Distinct from Integration (which is service-to-service).
- Integration — two or more services / modules talking. Often a step deeper than functional.
- UAT — user acceptance, run by stakeholders before sign-off.
- API — endpoint behaviour: status / payload / response shape.
- Security — auth, token handling, permission boundaries, OWASP-style cases.
- Performance — latency, throughput, load behaviour.
- Exploratory — unscripted poking around; record what you found.
- Other — escape hatch for anything that doesn't fit.
Test Type is always a manual pick — choose whichever category fits.
CI integration
Hook your CI pipeline (GitHub Actions, GitLab CI, Jenkins, or anything that can curl) into TestDossier. Automated results stay together in immutable Test Runs. If a result does not match an existing case, TestDossier can create a draft definition for you to review. CI reports what ran; you decide what the maintained test should say.
- Select the current project name in the top bar, then choose Access tokens….
- Pick a label (e.g. "GitHub Actions"), leave CI ingestion ticked, and create a token — copy the plaintext immediately, we only show it once.
- POST CI results to
/api/ci/ingestwithAuthorization: Bearer <token>. Three input families cover five formats:- Generic JSON: a
testsarray; each test acceptsname,ticket,dossier_id,result,duration_ms,failure_message, andsteps. - JUnit XML: send
Content-Type: application/xmlwith the standard JUnit report. Cypress, Playwright, pytest, Mocha, Jest all emit this when configured. - Cypress / Playwright / Cucumber JSON: native runner output with the header
X-CI-Format: cypress,playwrightorcucumber. Carries retry attempts, artifact metadata and (Cucumber) Gherkin steps — richer than JUnit.
- Generic JSON: a
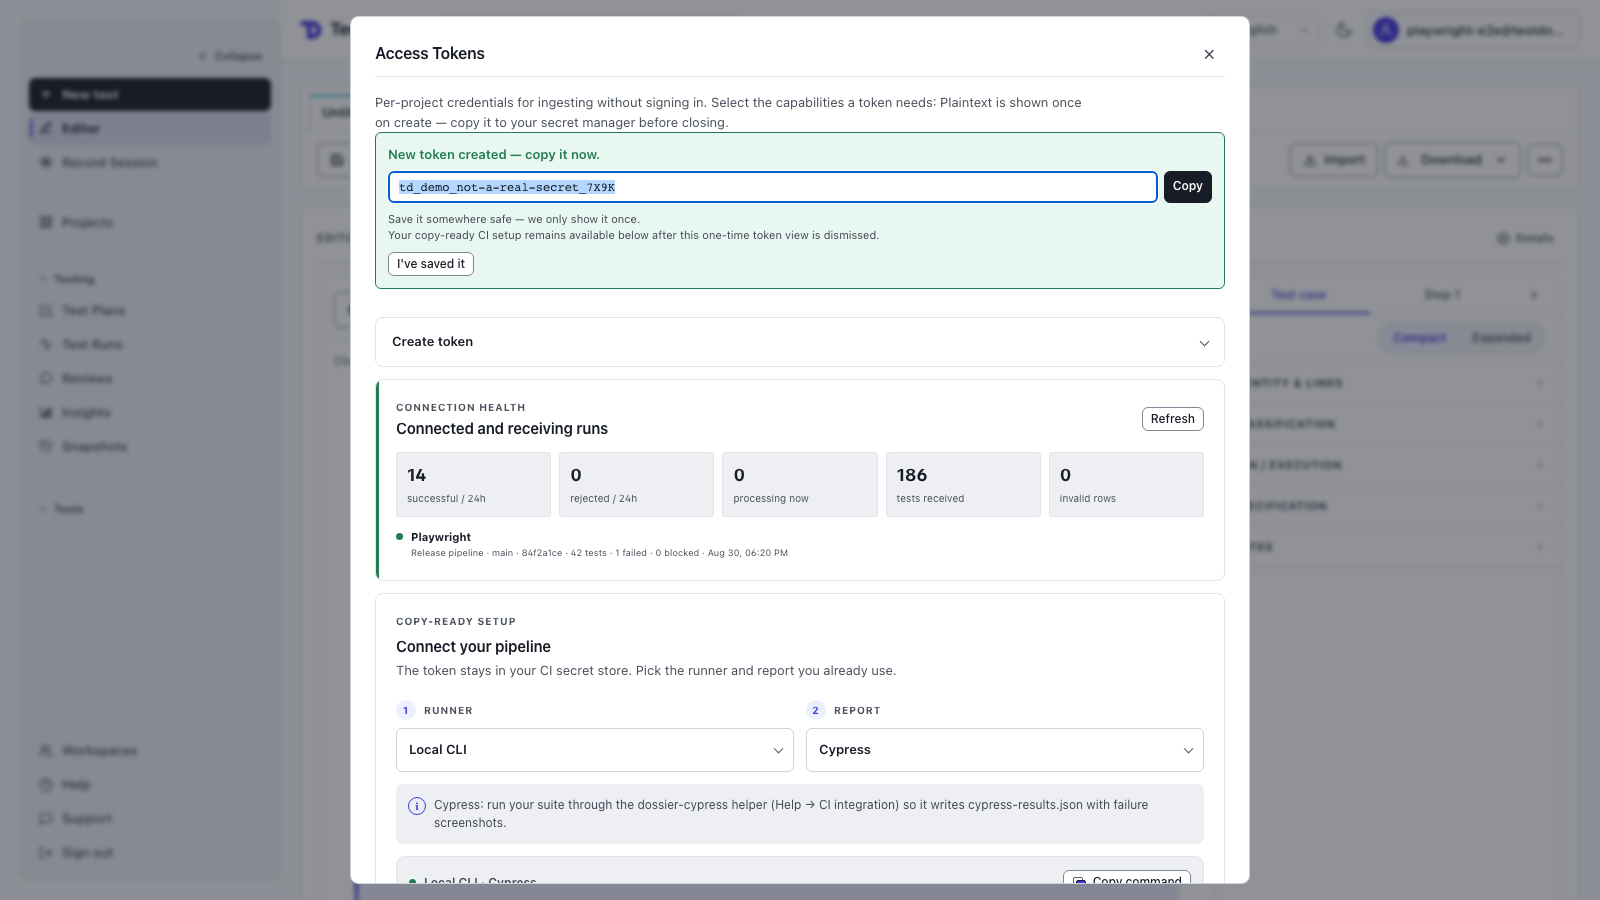
Cypress result + screenshot helper: install testdossier@0.3.0 or later in the repository, then run npx testdossier setup cypress from the project root. The command copies the reviewable, version-pinned template from the installed package to scripts/dossier-cypress.mjs; it downloads no code and never overwrites a different file. The helper writes the native { runs: [...] } result shape and embeds bounded failure screenshots.
How a CI run finds its test case (resolution order, most-specific first):
dossier_idon the test → exact match against the case's stored ID. Stable across renames; survives suite moves. Recommended for new wire-ups.dossier_id→ alias index. Imports (TestRail CSV, Zephyr Scale, Xray Cloud) auto-register the source-tool ID as an alias, so existing test code keeps pointing at the right case without rewrites. Example: a TestRail case imported asC42resolves when CI sendsdossier_id: "C42".ticketexact match.- Test signature — an exact match on the test's
file + suite + title. This is how a run with no explicit id still finds the same case on every re-run, with nothing to annotate. - Test
namecontains the case'ssummary(substring, ≥4 chars) — a loose last-resort fallback. - Miss → auto-create a reviewable draft. Any identifiable test—a marker, or just a name/file—can create a draft case with its own native
TD-<n>ID; authored steps from the payload become the proposed definition while the execution remains in its Test Run. A genuinely anonymous result stays untracked inside the run instead of appearing in Snapshots without a case.
Send rich steps from Playwright: the wrapper at dossier-playwright.ts (single file, copy-paste, no extra npm package) exposes dossier.id('LOGIN-001').step('action', 'expected', fn). Each step() call becomes a row in the auto-created draft, and a failed test includes one bounded final-viewport screenshot for durable R2 evidence.
Run locally or on a self-hosted runner (all formats)
Your tests do not have to run on GitHub-hosted infrastructure. Run them on a developer laptop, an office test machine, or a self-hosted CI runner; TestDossier only receives the finished report. This is useful when hosted CI minutes are exhausted. The machine needs outbound HTTPS access to TestDossier, and the project access token must stay in an environment variable or secret manager.
- Generate one of the supported reports on that machine:
- Cypress: generate the helper with
npx testdossier setup cypress, review it, then runnode scripts/dossier-cypress.mjs --output cypress-results.json. - Playwright: configure its JSON reporter with
outputFile: 'playwright-results.json'and runnpx playwright test. The downloadable wrapper above can instead upload each test automatically whenTD_URLandTD_CI_TOKENare set. - JUnit: enable your framework's JUnit reporter and write
junit-results.xml. - Cucumber: emit the standard Cucumber JSON report, for example
npx cucumber-js --format json:cucumber-results.json. - Generic JSON: write the canonical
testdossier-ci.jsonfile containing atestsarray.
- Cypress: generate the helper with
- In TestDossier, open Access tokens…, choose Local CLI, and copy the generated command. The zero-dependency uploader only reads a finished report and sends it over outbound HTTPS; it never runs tests, accepts remote commands, or stays running.
# Run these commands in the project containing your automated tests,
# not in the TestDossier CLI package directory.

# 1. Install the latest CLI. Replace @latest with an exact version such as
# @0.3.5 when the project must pin a specific release:
npm install --save-dev testdossier@latest

# 2. One-time setup — creates .env.testdossier with owner-only permissions
# and adds it to .gitignore:
npx testdossier init

# 3. Paste the token shown once by TestDossier into .env.testdossier,
# replacing the placeholder value, then check the wiring without
# sending any report data (validates token, capability, and project):
npx testdossier verify

# 4. Run the tests. Configure Playwright's JSON reporter first so this
# command creates playwright-results.json:
npx playwright test

# 5. Upload that completed report.
# This filename is an example; use the actual path written by your runner.
# If tests run in shards or batches, merge every shard report first.
# The CLI automatically pages merged Playwright reports above 200 tests.
npx testdossier upload playwright-results.json

# The first successful upload remembers the report path in testdossier.json
# (commit that file). Every later publish is just:
npx testdossier

# Validate and detect without sending anything:
npx testdossier upload playwright-results.json --dry-run
Attach source context to CI runs
Source context is off by default. Enable it in the committed testdossier.json file when the repository is authorized for upload:
{
  "report": "playwright-results.json",
  "source": {
    "enabled": true,
    "root": ".",
    "before": 20,
    "after": 80
  }
}
The CLI uses only file and line metadata reported by the test runner. Paths must stay inside the real, non-symlink source root. Missing, symlinked, binary, invalid UTF-8, and files over 2 MiB are skipped. Each uploaded excerpt is capped at 2,000 lines and 128 KiB, and common credential literals are redacted before hashing and upload. --dry-run reports paths, line ranges, hashes, truncation, and redaction counts without printing source content.
Uploaded source is frozen with that Test Run; the Editor keeps the current editable version, and a changed digest becomes a Review proposal instead of rewriting history. TestDossier never writes to your repository. Source code is also excluded from shared reports unless the owner separately enables Include source code for that share.
After the upload succeeds, refresh the access-token connection health. The execution appears in Test Runs and Insights, like a GitHub-triggered run. If you use a GitHub self-hosted runner, keep the GitHub recipe and change the job to runs-on: self-hosted.
Build / branch metadata: pass X-Build and X-Branch headers, or include them as body fields in the generic JSON path. They show up on the snapshot row and the share page.
Idempotency: pass X-CI-Run-Id (e.g. ${{ github.run_id }}_${{ github.run_attempt }}). Re-uploading within the same workflow attempt returns the original ingest summary; a GitHub rerun increments run_attempt and correctly records a new execution.
Unbounded runs (paging). One request accepts up to 200 tests (echoed as max_tests_per_page in every response) — over that it returns 413 (never a silent truncation). For a larger run, page across requests: keep the same X-CI-Run-Id and send a unique X-CI-Page-Id per page (a 1-based counter). Idempotency then keys on (run, page) — re-sending a page replays its summary, while a different page of the same run accumulates. Slice a generic-JSON { "tests": [...] } report into 200-test pages and POST each.
Connection health: the Access tokens dialog stays useful after token creation. Its setup recipe persists, can switch between GitHub Actions, GitLab CI, Jenkins, and raw curl plus every supported report format, and shows successful, rejected, pending, test, and invalid-row counts for the last 24 hours with recent ingest events. Refresh it after the first workflow run to verify the artifact and parser are correct.
Definition vs execution—never silently overwritten. Once you approve a draft, CI never rewrites the maintained steps or expectations on a later run. New results remain in Test Runs. If CI reports a changed definition, it appears as a drift proposal you can apply or keep—never as a silent edit.
GitHub Actions example. Drop this into .github/workflows/cypress.yml — runs nightly + on every PR, uploads results to TestDossier:
name: Cypress
on:
  schedule:
    - cron: '0 2 * * *'    # nightly 02:00 UTC
  pull_request:
  push:
    branches: [main]
jobs:
  cypress:
    runs-on: ubuntu-latest
    steps:
      - uses: actions/checkout@v4
      - uses: actions/setup-node@v4
        with: { node-version: 20, cache: npm }
      - run: npm ci
      - name: Run Cypress and collect failure screenshots
        run: node scripts/dossier-cypress.mjs --output cypress-results.json
      - name: Send results to TestDossier
        if: always()
        env:
          TD_CI_TOKEN: ${{ secrets.TEST_DOSSIER_CI_TOKEN }}
          TD_CI_URL: ${{ github.server_url }}/${{ github.repository }}/actions/runs/${{ github.run_id }}
        run: npx testdossier upload cypress-results.json
Four things that trip people up:
if: always()belongs on the upload step — it sends the result file even when Cypress fails. Do not putcontinue-on-erroron Cypress; the workflow should remain red when tests fail.- The uploader derives a stable run ID from GitHub's run ID and attempt — duplicate retries dedupe, while an intentional GitHub rerun records a fresh execution.
- The uploader exits non-zero when TestDossier rejects the report, so a missing token or oversized page cannot silently look successful.
- Transient network, conflict, rate-limit, and server errors are retried automatically with the same idempotency key.
- Local screenshot paths are not uploads. The supplied Cypress helper embeds bounded failure screenshots; the server moves those bytes to R2 and stores durable references.
Other frameworks: Playwright's JSON reporter with an outputFile is accepted with X-CI-Format: playwright; it preserves retries, authored test.step() structure, and local artifact references, but local paths do not upload pixels. Use the supplied Playwright wrapper when you want a durable failure screenshot. JUnit XML needs Content-Type: application/xml and no format header; it carries testcase results, durations, failure/error text, and optional td:* properties, but standard JUnit has no portable screenshot-byte field. Generic JSON is the framework-neutral path for attachments[].data_url or durable HTTPS evidence URLs.
Reviewing CI-created drafts
When CI auto-creates a case (resolution path #5 above), it lands as a draft: visible in the project canvas with a small review pill, counted in Insights → Needs attention, and not included in share links until a human signs it off. Open the review queue from the sidebar or from the "N cases to review" item in Insights.
The queue: the list on the left advances automatically; the preview on the right shows the action, expected result, and steps for the selected draft. Review happens inside this page. Select Open in editor only when a case needs fuller editing.
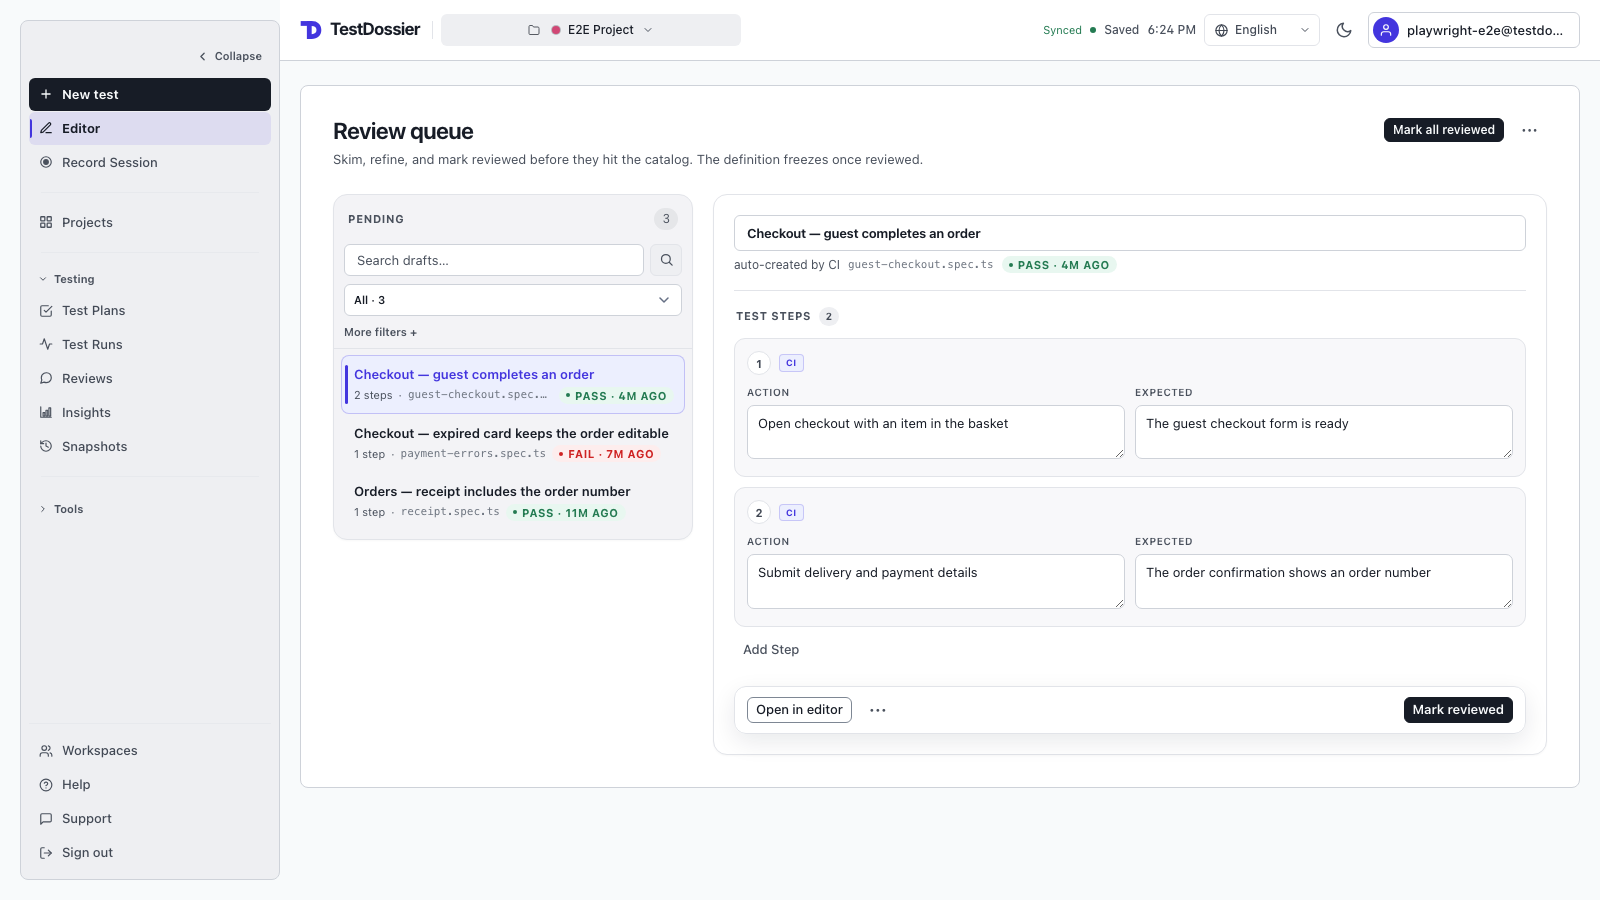
Filters narrow large queues:
- Failed — drafts whose latest snapshot is FAIL. The bugs to triage first.
- Needs authoring — the stub bucket: under 2 steps, or any step's expected text is under 8 chars or a
TODO/ placeholder. CI gave you a skeleton; a human has to flesh it out before it's trustworthy. - Clean — the inverse, ready-to-bulk-approve set: 2+ steps, every step has real expected text, and the latest CI run isn't failing. Filter here, then Mark all reviewed with confidence.
Bulk approve is the dominant primitive at scale. The "Mark all N reviewed" button confirms before flipping — at 500 drafts a careless click would be expensive. A safety net catches you: every reviewed case shows an undo pill on its row for the next 24 hours. One click reopens it for refinement.
Keyboard: J / K moves to the next or previous draft, A approves the current draft and advances, Shift+A bulk-approves the active filter, E opens the case in the editor, and Esc closes the review page.
Audit trail: every approval records who approved it, when, and whether it was part of a bulk action. Workspace teams can answer “who signed this off?” from Activity.
Review, report, and collaborate
Insights
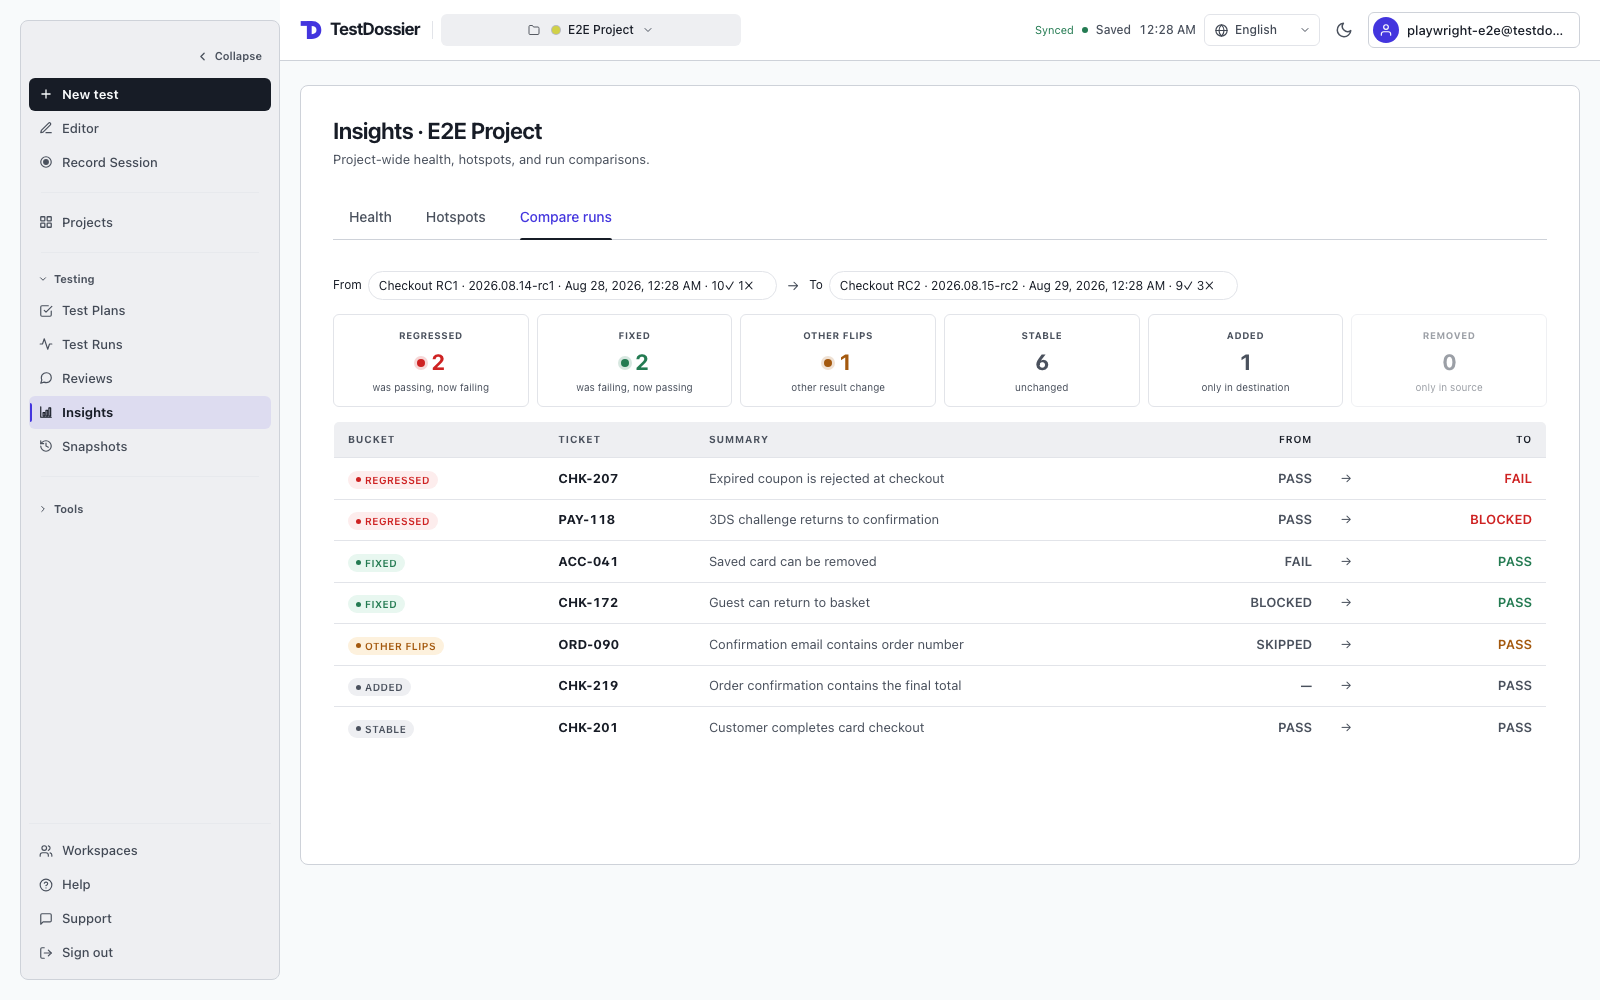
Open Testing → Insights and select a project. The dashboard shows pass rate, run count, latest activity, case count, daily run charts, and failure hotspots. Manual, API automation, and CI activity are separated so their failures can be investigated in the right context.
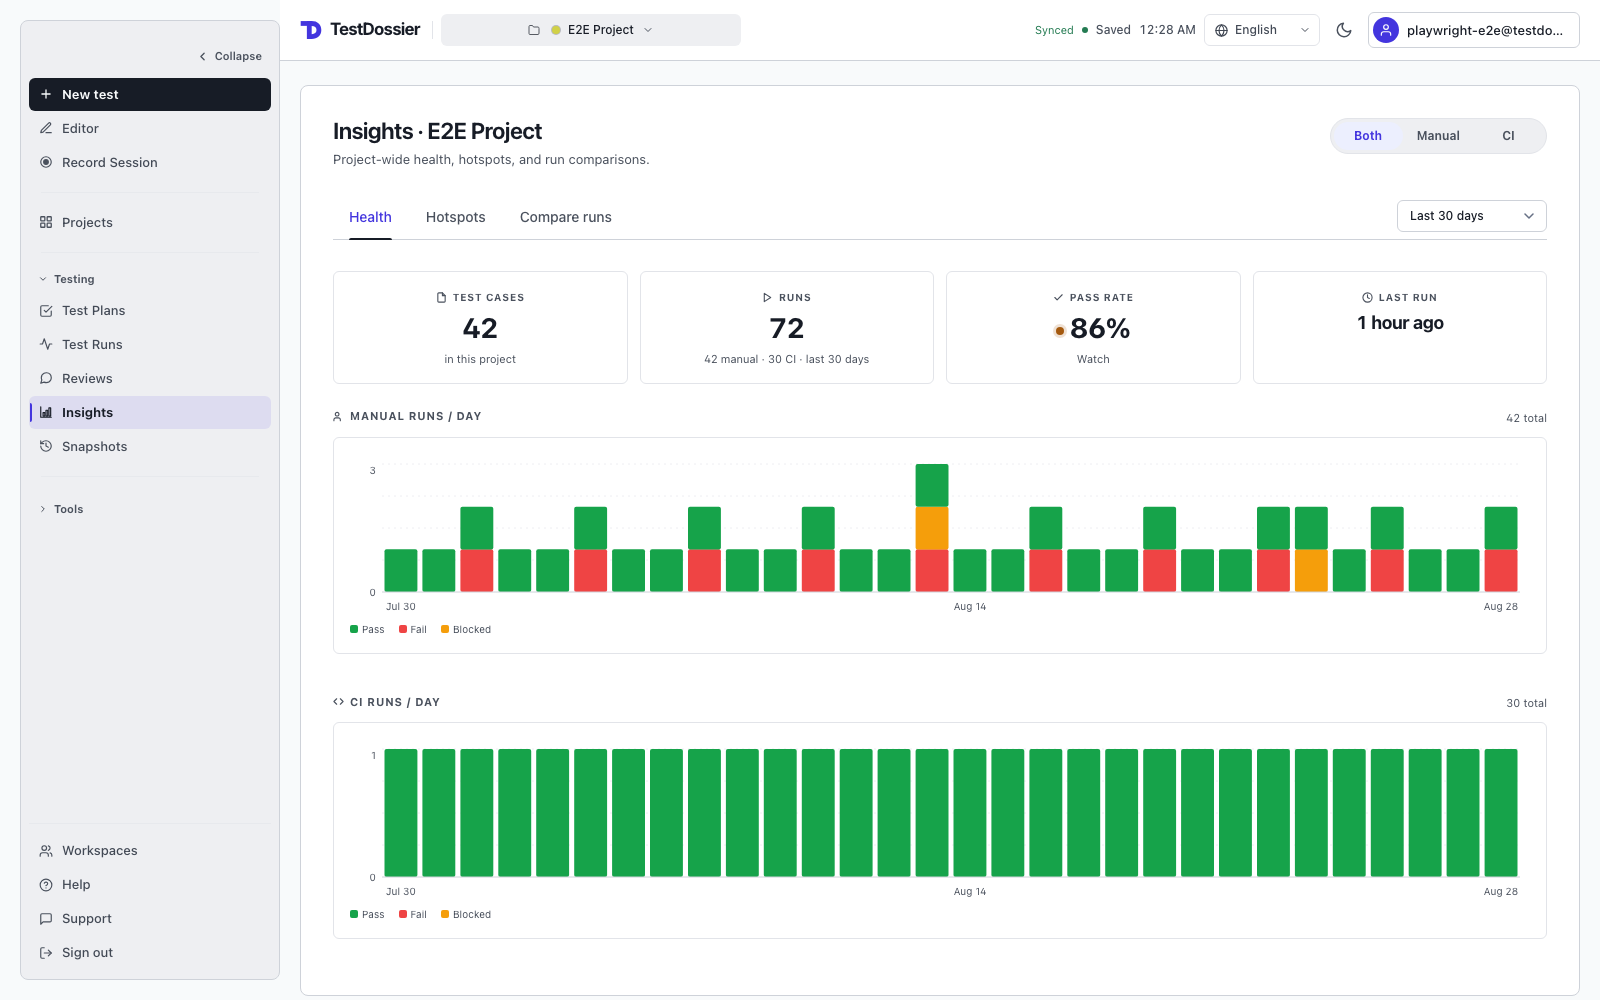
"Needs attention" banner: sits above the KPI cards and surfaces drafts awaiting review + cases that haven't appeared in a CI run for 14+ days. Each count is a click — jumps you straight into the review canvas (or the stale-cases filter) so triage is one move from the dashboard. Banner hides itself when there's nothing to attend to.
Per-test-case-per-day rollup. The chart counts test cases as the unit, not raw fires. Multiple snapshot rows on the same day fold into one logical row per (test case, day, tester) with a fail-priority rule (any FAIL → the test case is FAIL for that day). Hotspots and the share-page snapshot use the same rollup.
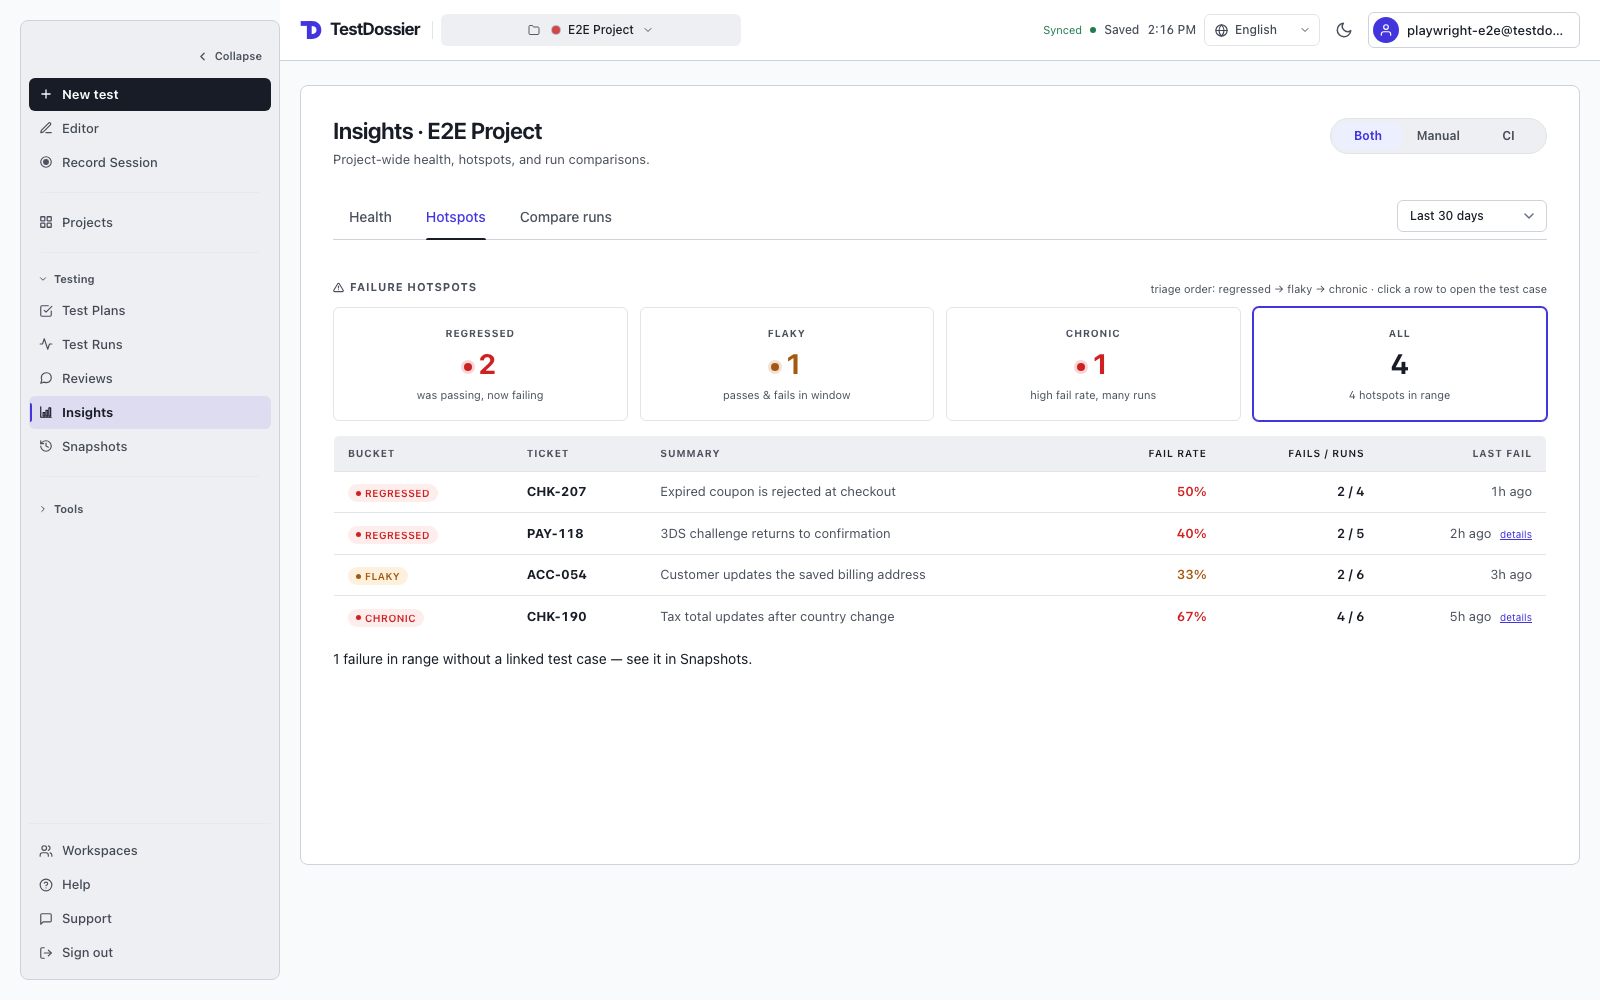
Chart ⇄ List toggle: the control in the Insights header switches between charts and a day-by-day list of failed cases. Selecting a chart bar opens the List view at that day. A manual failure opens its case; a CI failure opens its available artifacts. Unmatched CI runs carry an UNTRACKED chip.
Range selector in the header (7 / 14 / 21 / 28 / 30 / 60 / 90 days) — defaults to 30 days. Range and view choice persist across sessions.
Real-time presence
Inside a workspace, a small green dot above the editor shows when a teammate is viewing the same test case. Hover the dot for the email list. Presence refreshes every 10 seconds while the page is visible and pauses when it is in the background.
Activity feed
Open Workspaces → Manage → Activity to see runs logged, cases edited or restored, comments posted, and plans created. Each entry links to its source; run links open the related item in Snapshots.
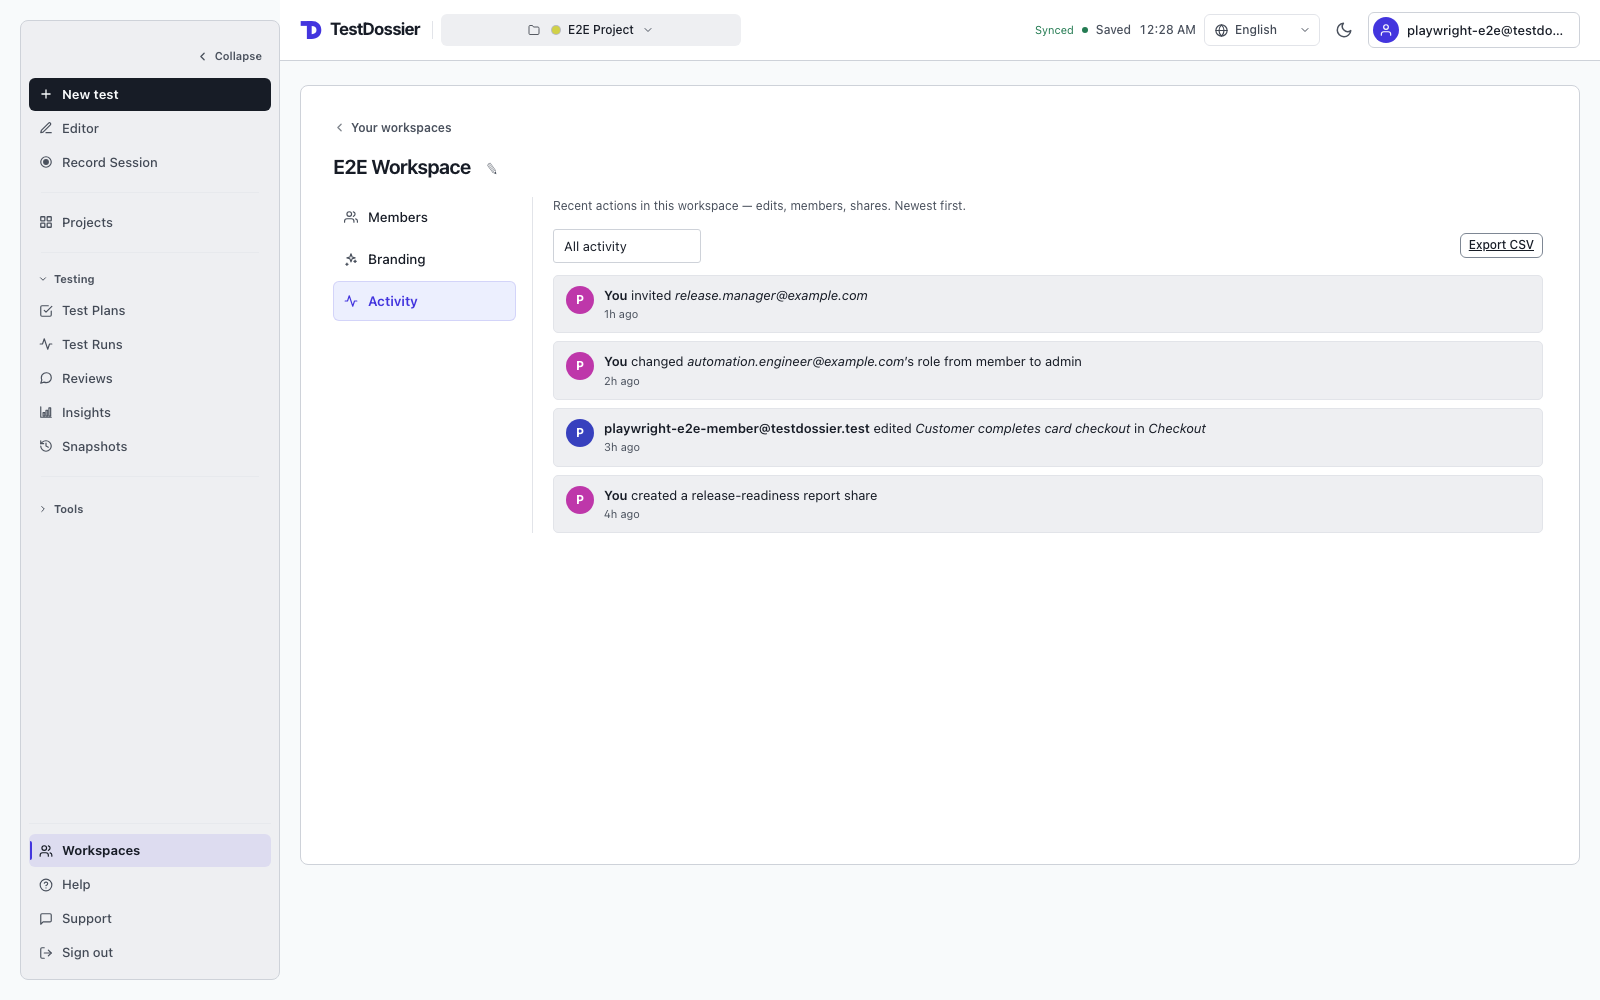
Use it as a low-effort standup feed: open the workspace in the morning and skim the feed instead of asking "what changed yesterday?"
Share as report
Open Testing → Snapshots, select the snapshot rows to include, and choose Share as report. The link bundles the selection into one read-only page. You can add a password and enable privacy-preserving detailed analytics. Personal collections require QA Pro; workspace collections require an active QA Team workspace.
Useful when posting nightly results to a channel where stakeholders don't have TestDossier accounts — or sending a customer a self-contained "what we tested for your release" page.
Branding
For a personal QA Pro project, select the account button at the bottom left and open Branding. For QA Team, open Workspaces, choose Manage, then Branding. Upload a logo, choose a brand color, and set a display name. New shares use that identity across the public report and printable cover. Branding is captured when a share is created, and the secure link remains testdossier.com/s/….
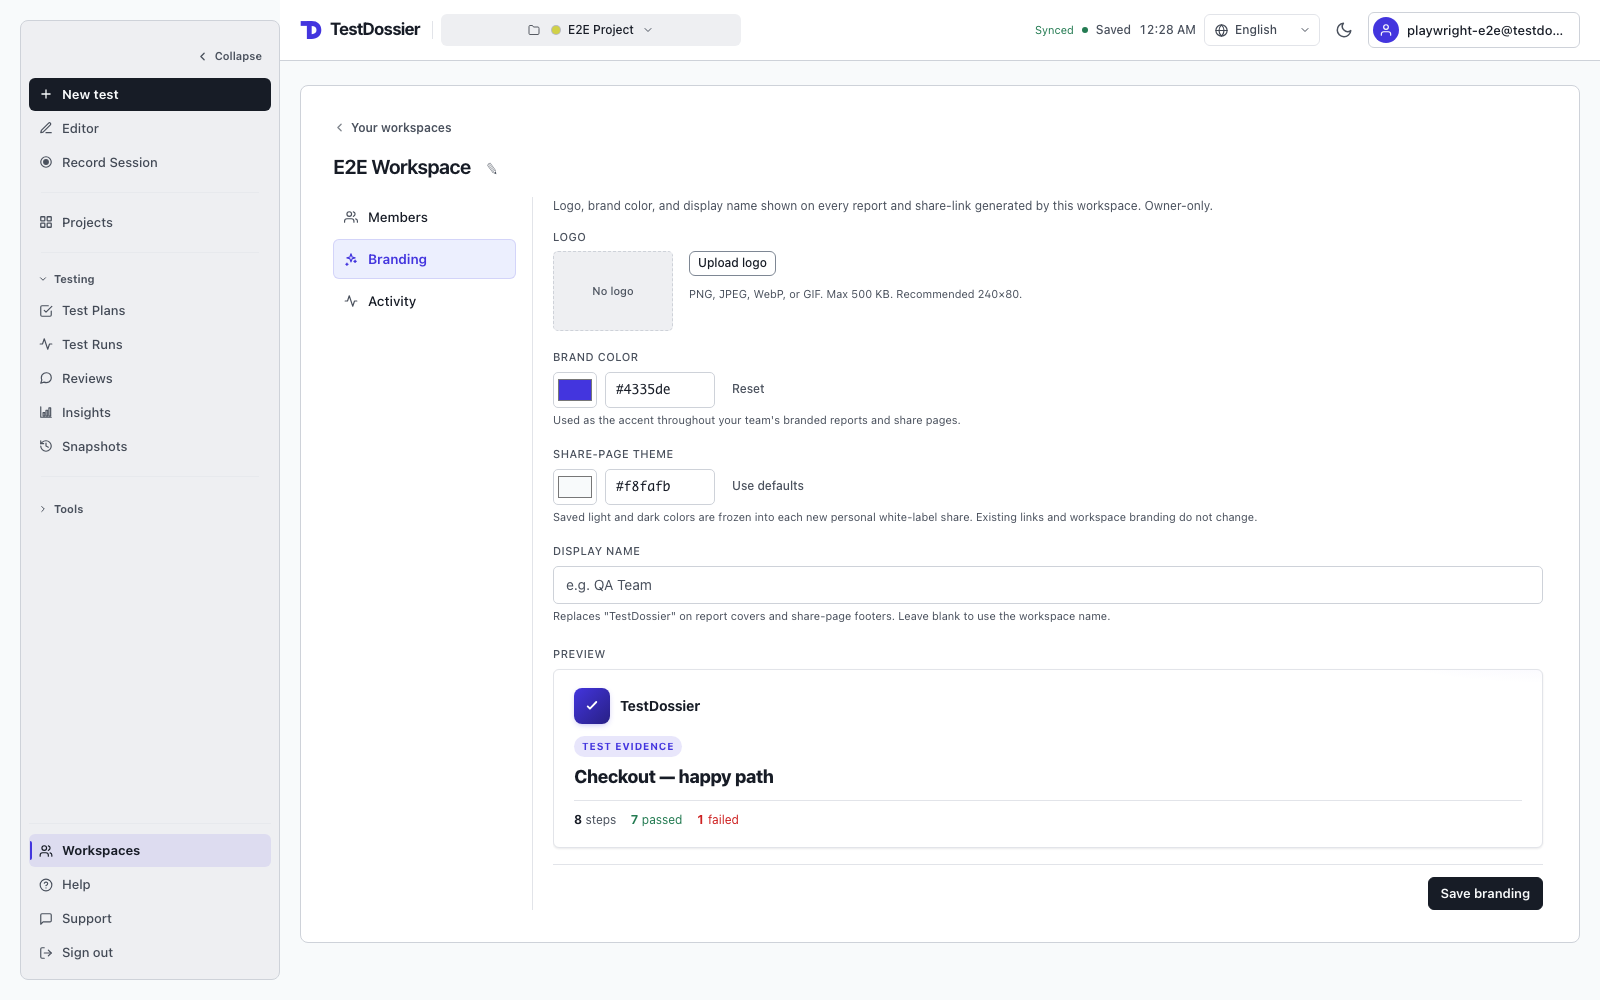
Workspace-scoped: a workspace owner sets the branding once and every member's exports inherit it, so customer-facing reports look consistent regardless of who ran the test. Personal Pro users brand only their own exports.
Snapshots + read-only versions
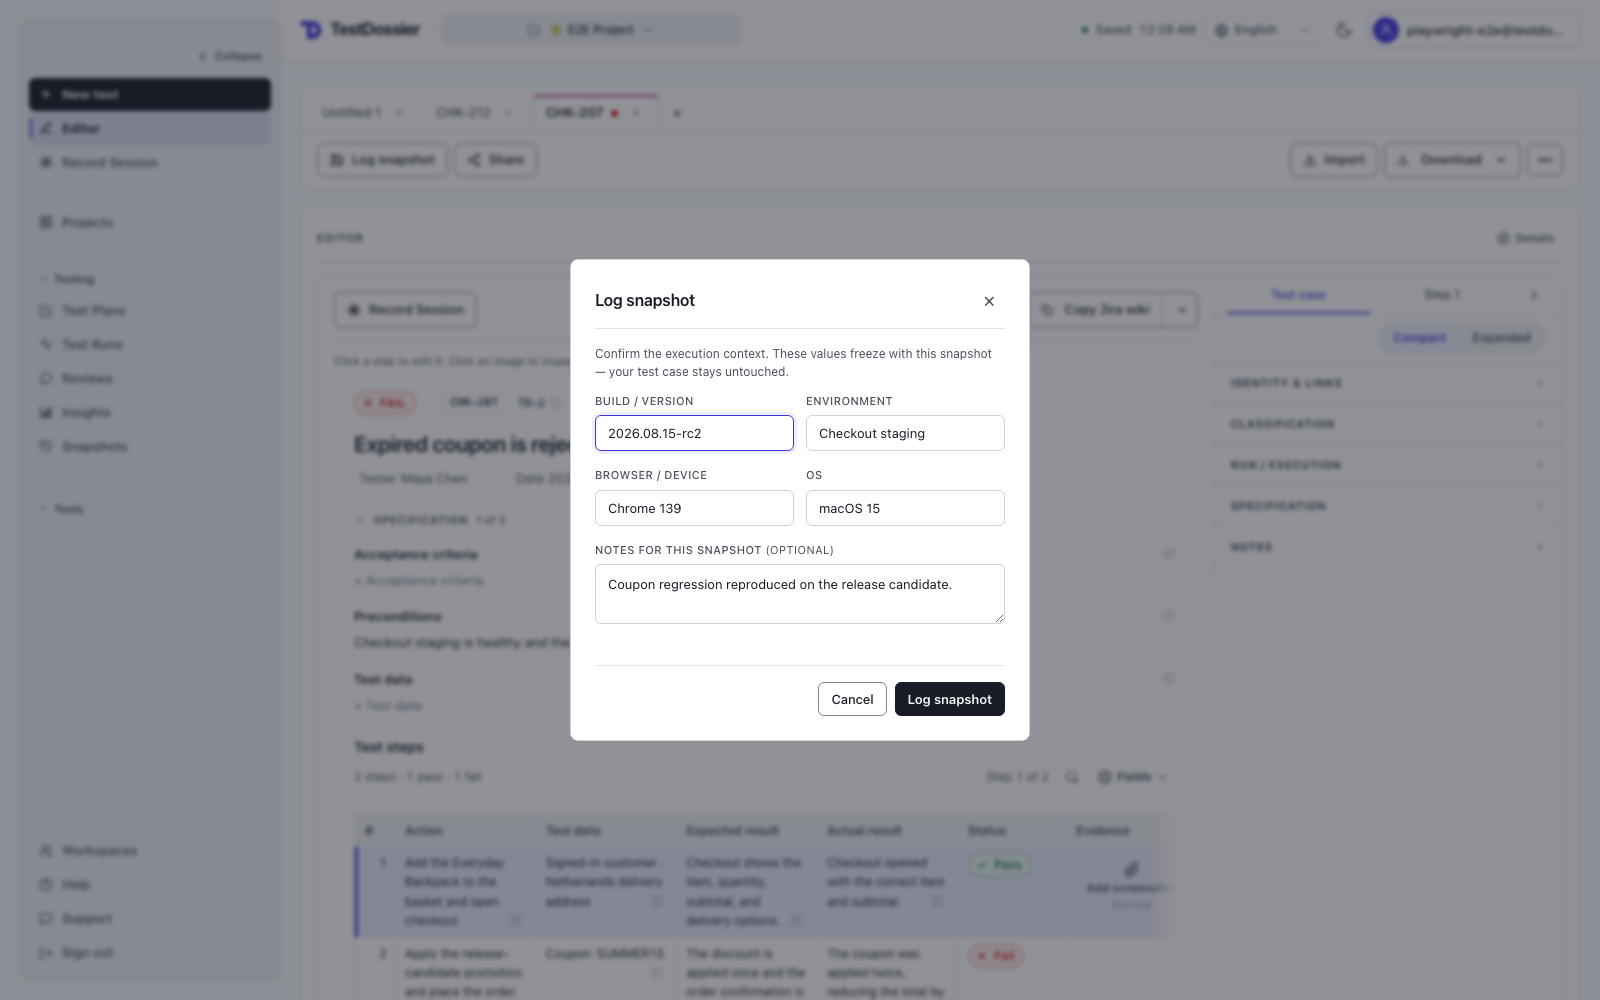
Select Log snapshot to freeze the current case and record Build / Version, Environment, Browser, OS, and optional Notes. Editing, autosaving, Capture Record or Update, and CI ingestion do not add entries to this page. Snapshots contains deliberate checkpoints; automated executions stay in Test Runs. The dialog reuses recent execution values when available; press Enter to log or Escape to cancel.
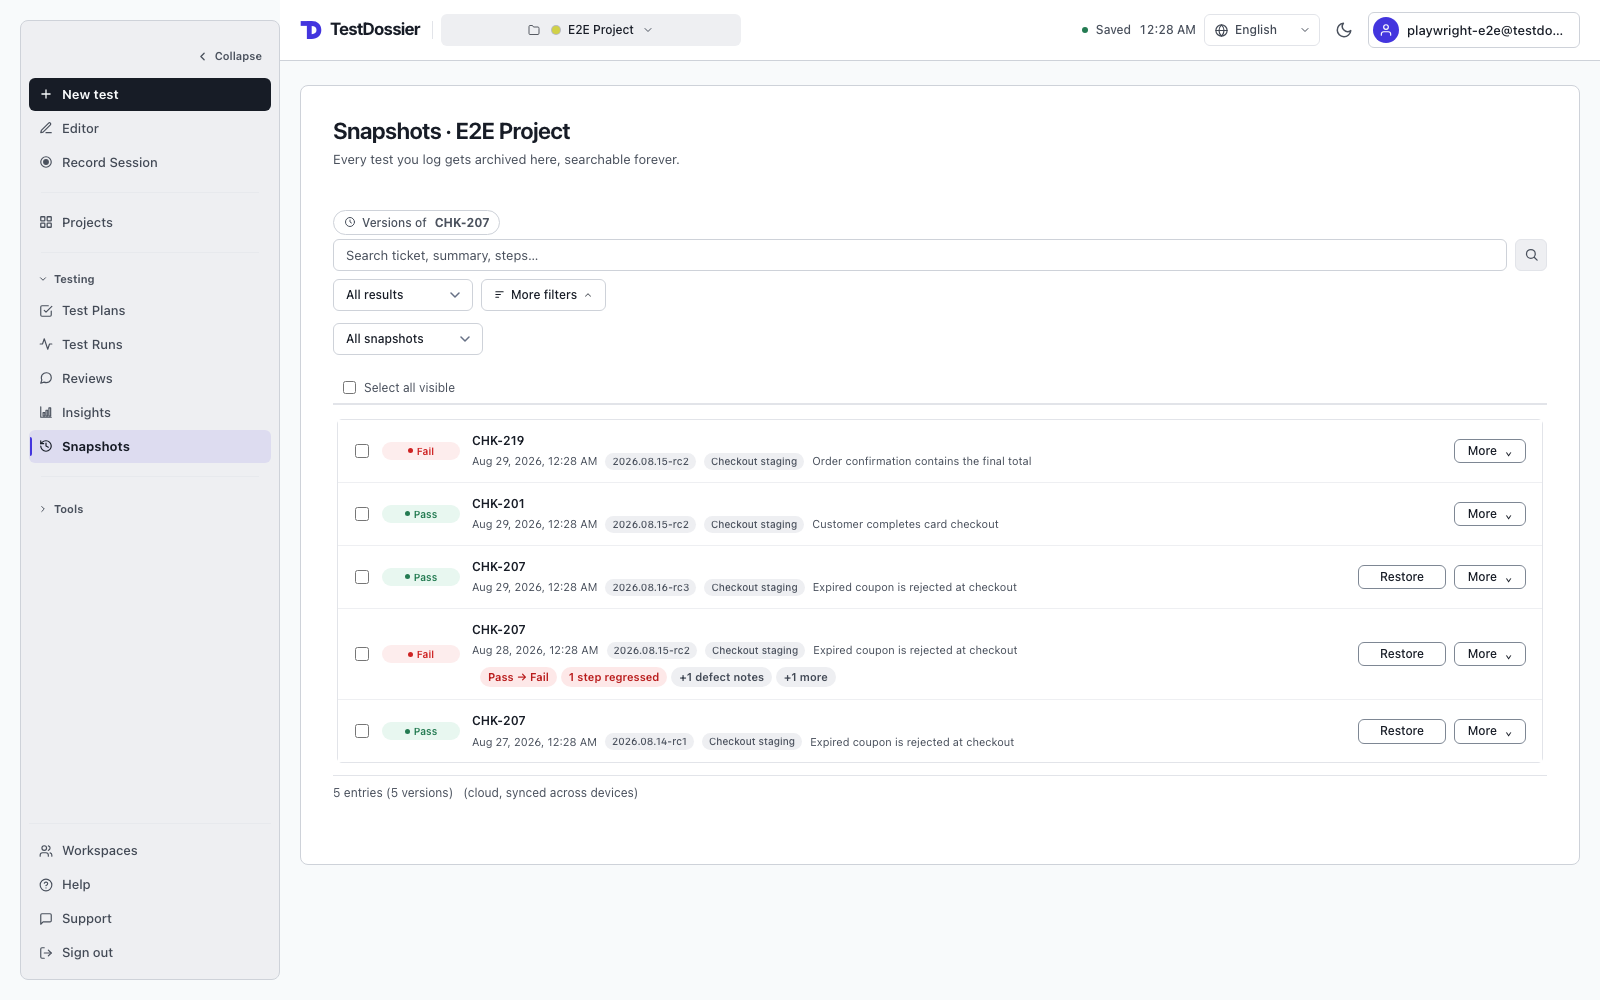
Open Testing → Snapshots in the sidebar to browse, filter, and compare logged evidence. Each row shows its captured Build and Environment so you can scan the execution context without opening it.
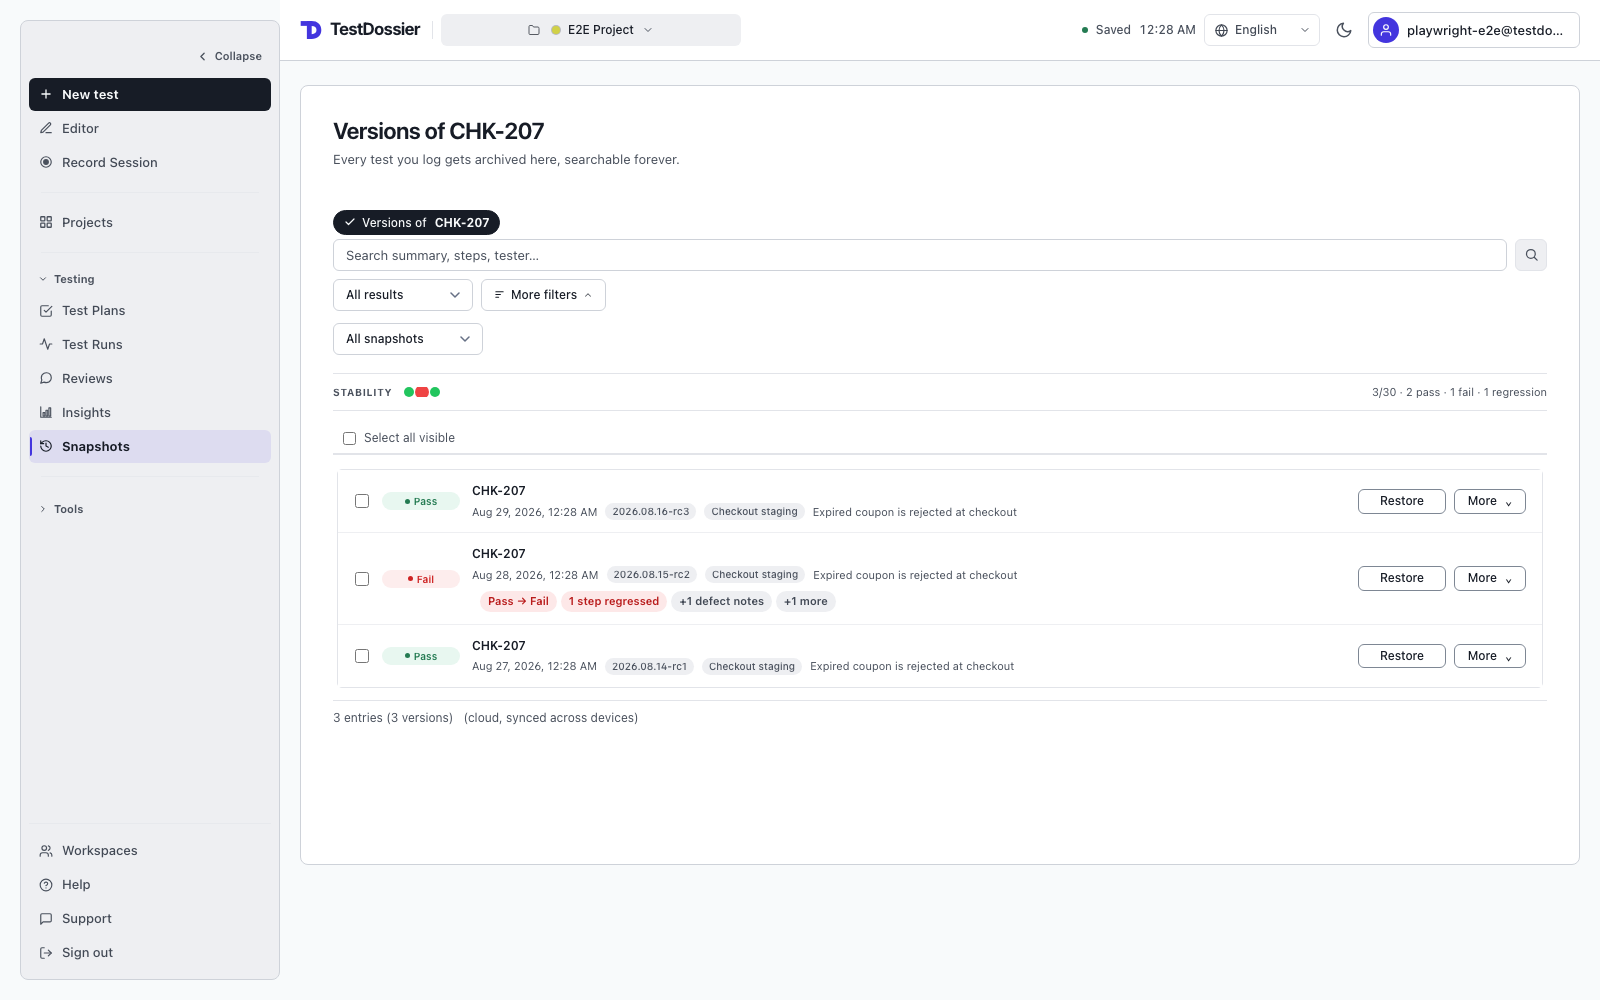
- Filter: by project, result (PASS / FAIL / etc.), text search, and All snapshots / Changed only / Regressed only. Active filters remain when you leave and return to Snapshots.
- Stability sparkline: when scoped to a single test case (Versions view), a 30-dot sparkline above the list shows the recent pass/fail/regression pattern. Each dot is one snapshot, oldest left to newest right; regressions (PASS → not-PASS at overall) carry a red ring.
- Inline diff chips: rows whose snapshot diverged from the previous one carry chips spelling out what shifted — FAIL → PASS, 2 steps regressed, 2 prose edits, +1 screenshot, etc. Stops at 3 chips per row with a "+N more" overflow on narrow widths; the diff viewer carries the full breakdown.
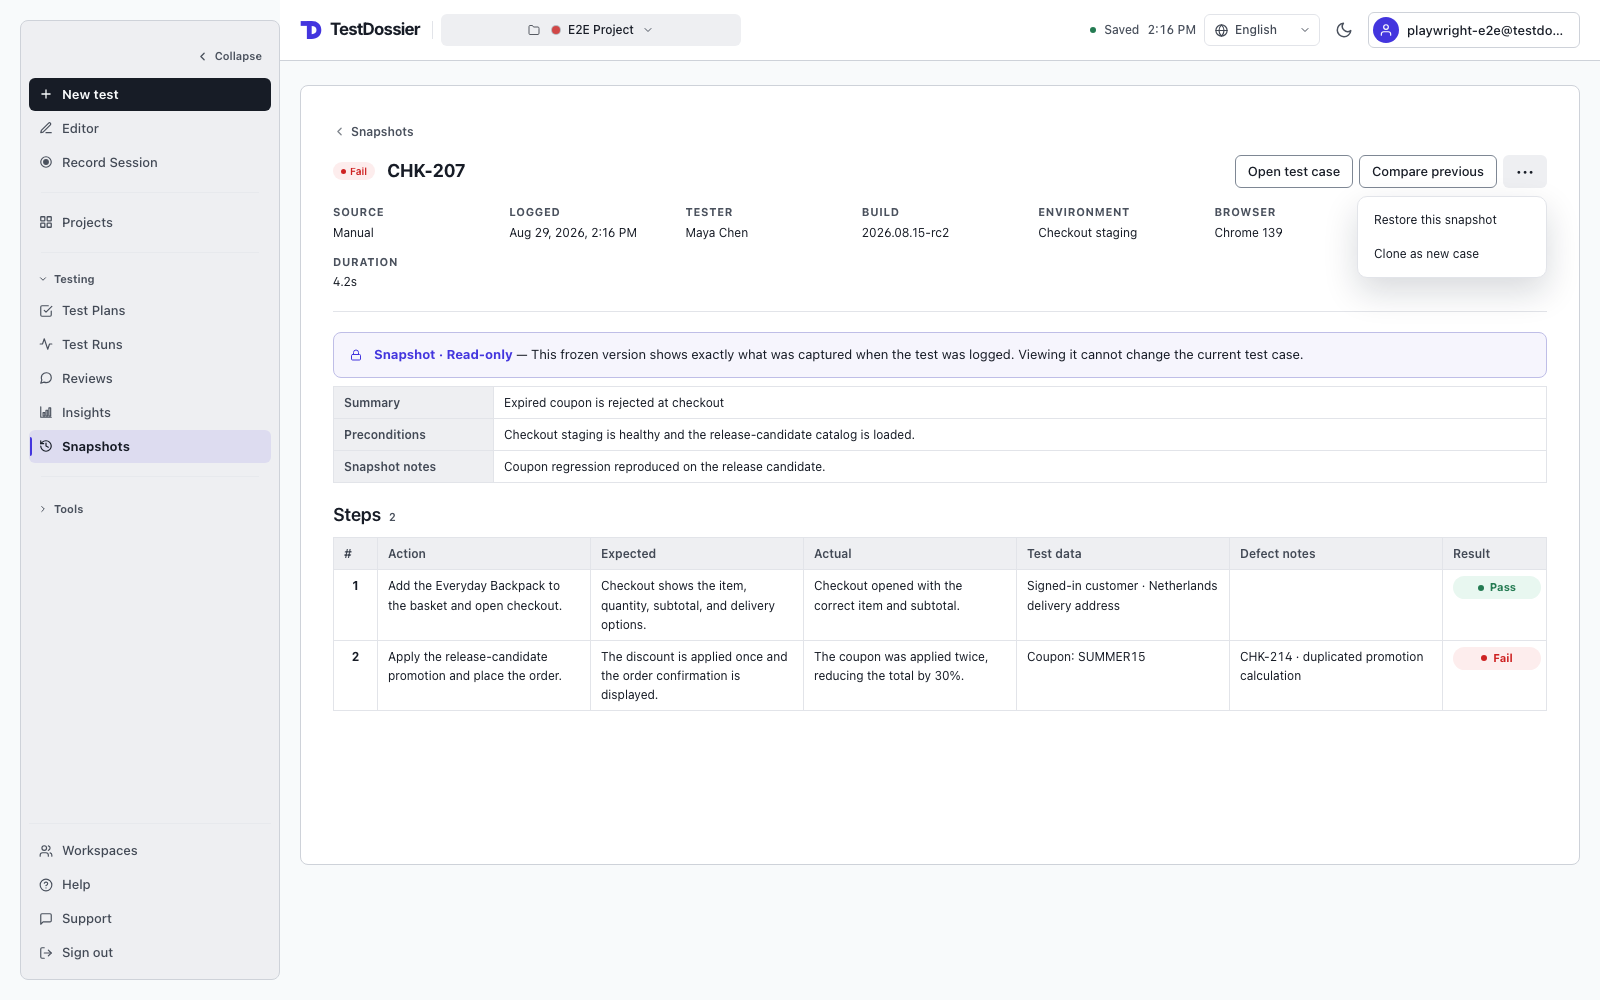
- Restore this snapshot replaces the snapshot's own live case with the frozen content. Use it deliberately when an older version should become the working definition again.
- Clone as new case opens a separate pending test case from the frozen content without changing the original case or checkpoint.
Retention. Snapshots older than 12 months are removed automatically. Each test case's most recent result and any snapshot included in a shared report are always kept, regardless of age.
Read-only Snapshot mode. Open a row to inspect the exact frozen fields, steps, verdicts, and evidence at its own address. Open test case and Compare previous stay visible. The three-dot menu holds Restore this snapshot and Clone as new case.
- More → Compare with current case — compares this snapshot's editable case content with the active case. Logged Build, Environment, Browser, OS, and Notes are shown separately as context, not falsely reported as removed content.
- Compare previous — from Snapshot mode, compares this checkpoint with the one logged immediately before it. No live case is involved.
- Compare 2 selected — bulk action, enabled when exactly two rows are ticked via the row checkboxes. Opens the older snapshot on the left, newer on the right. "What changed between then and now, ignoring everything between?"
One baseline per comparison. The viewer only shows the comparison you selected, with explicit left and right labels:
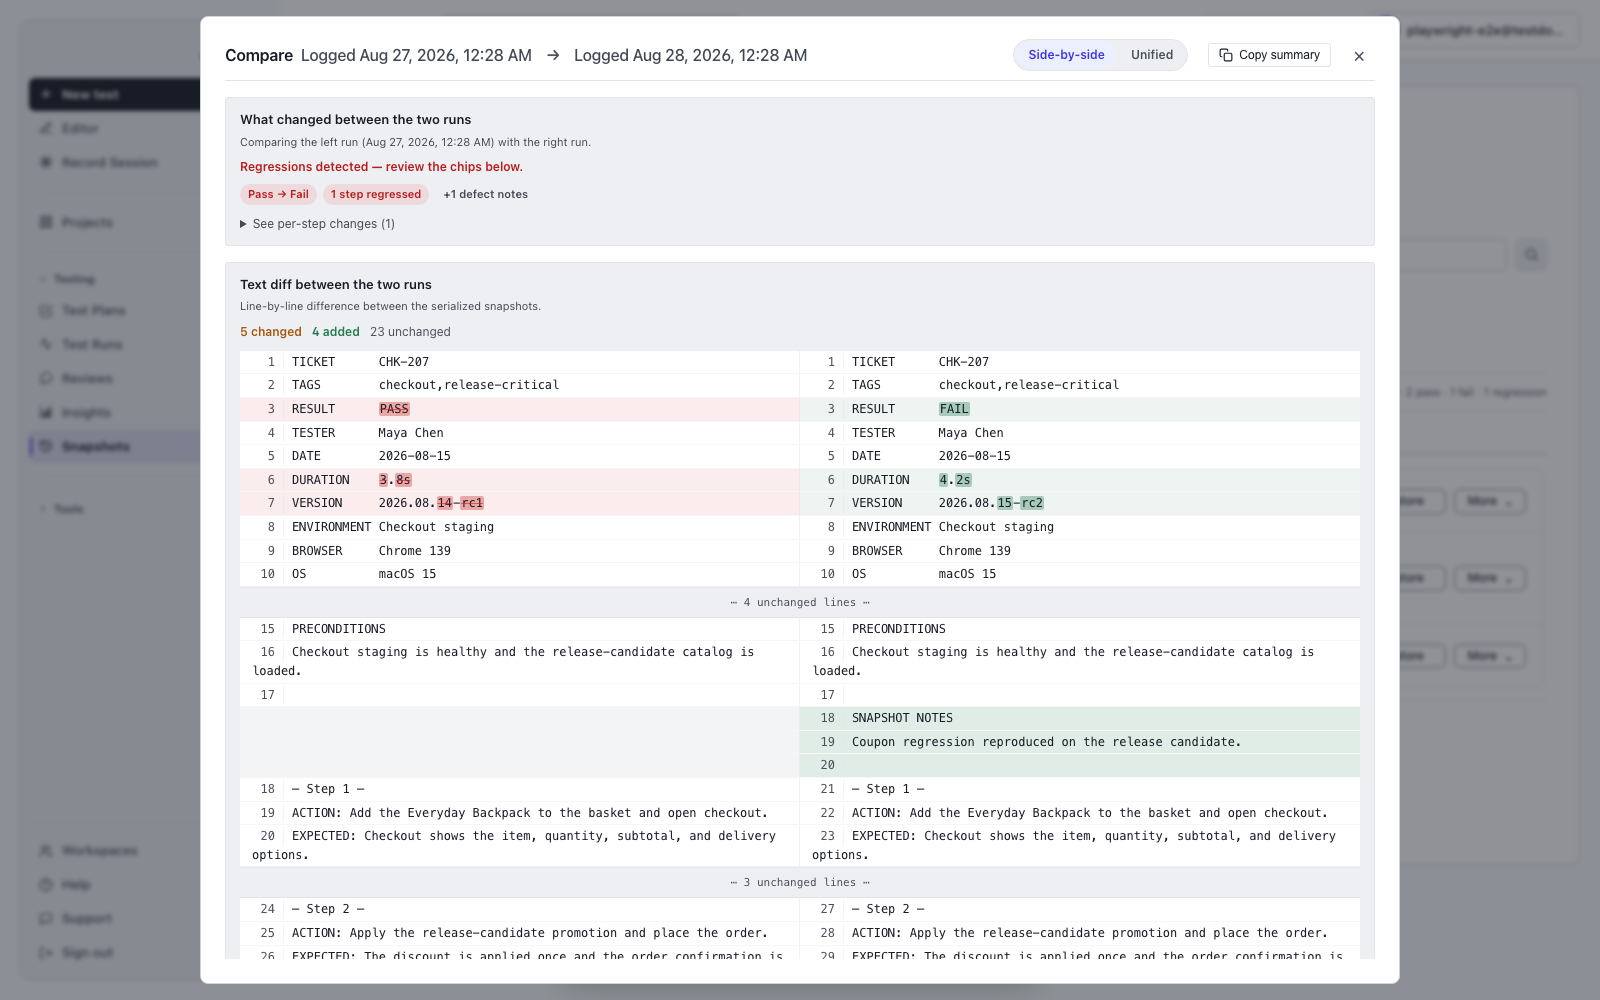
- Previous-snapshot comparison — shows the frozen verdict, structured change chips, step drill-down, and text changes from the previous checkpoint.
- Current-case comparison — shows only case-content differences between the selected snapshot and the editor now, followed by the snapshot's logged run context.
- Copy summary in the comparison header produces a plain-text digest ready to paste into Slack or a ticket comment.
Diff fidelity details. A few invariants worth knowing if you rely on the chips:
- Steps match by id, not position — reordering steps doesn't show as remove+add.
- Diff base skips near-duplicate checkpoints — entries created within 30 seconds with the same decided result are not used as a misleading comparison anchor; the viewer prefers the previous meaningful checkpoint.
Activity stays separate. Snapshots contains deliberate frozen checkpoints. Review-relevant edits remain in Activity, so the version timeline does not mix ordinary editing with the moments somebody chose to preserve.
Workspaces
A workspace is a shared container for projects, cases, runs, snapshots, plans, evidence, and branding. Presence updates are live, but case editing is not collaborative co-editing: simultaneous saves use conflict checks and may require one editor to refresh.
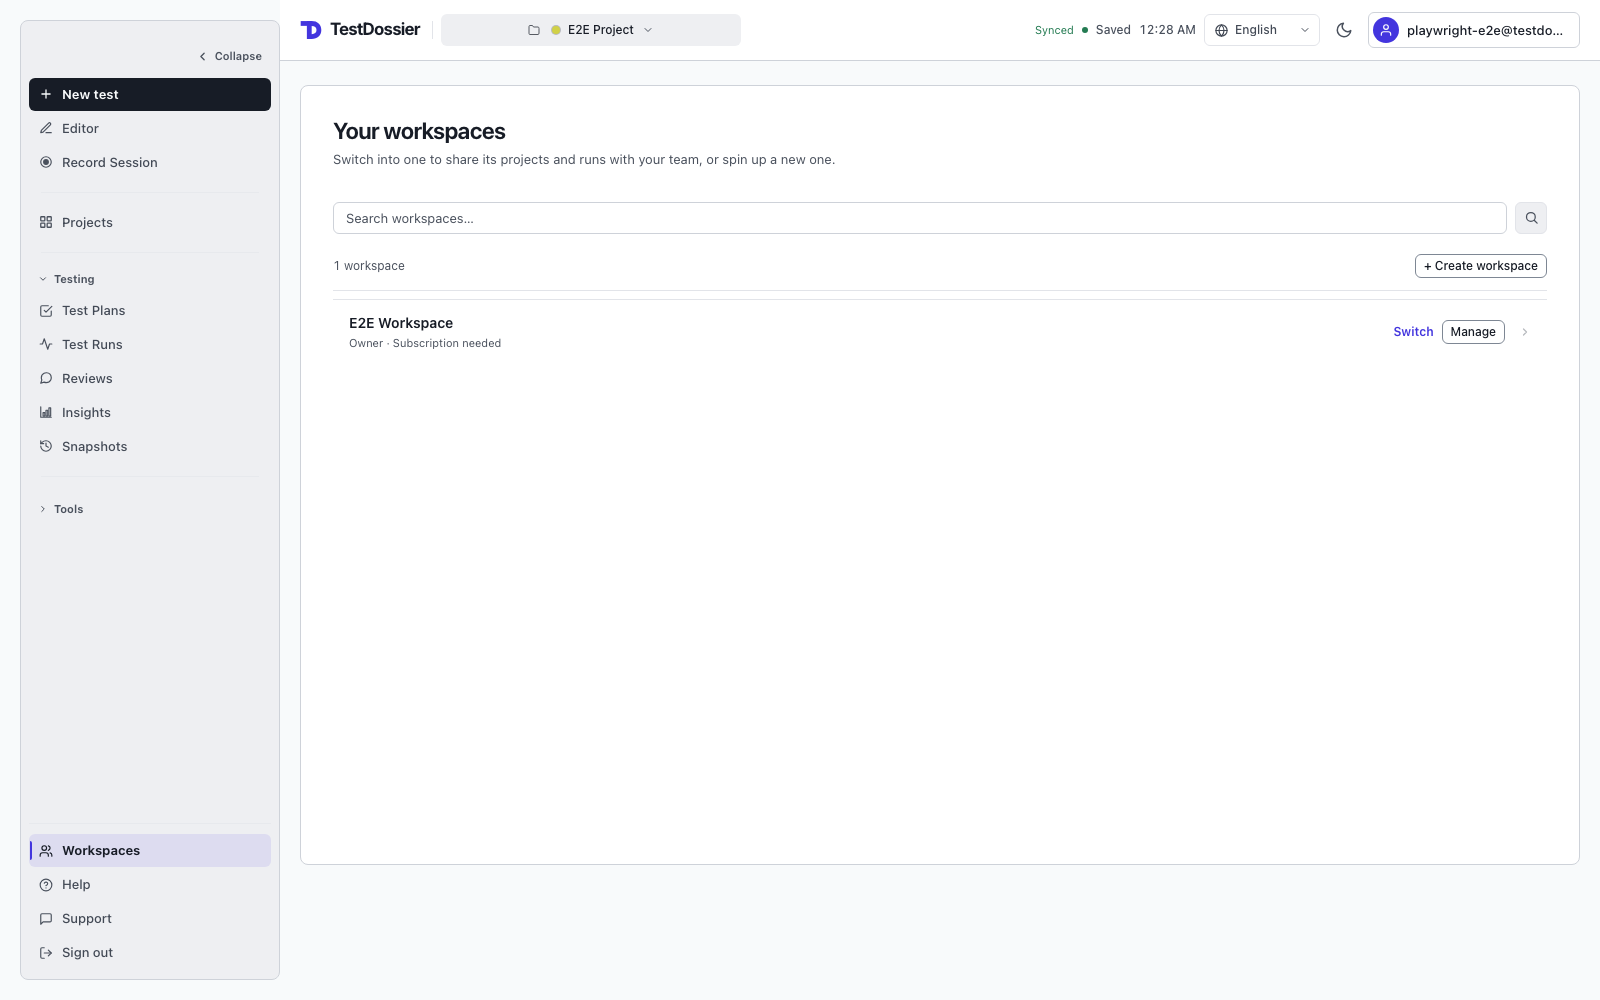
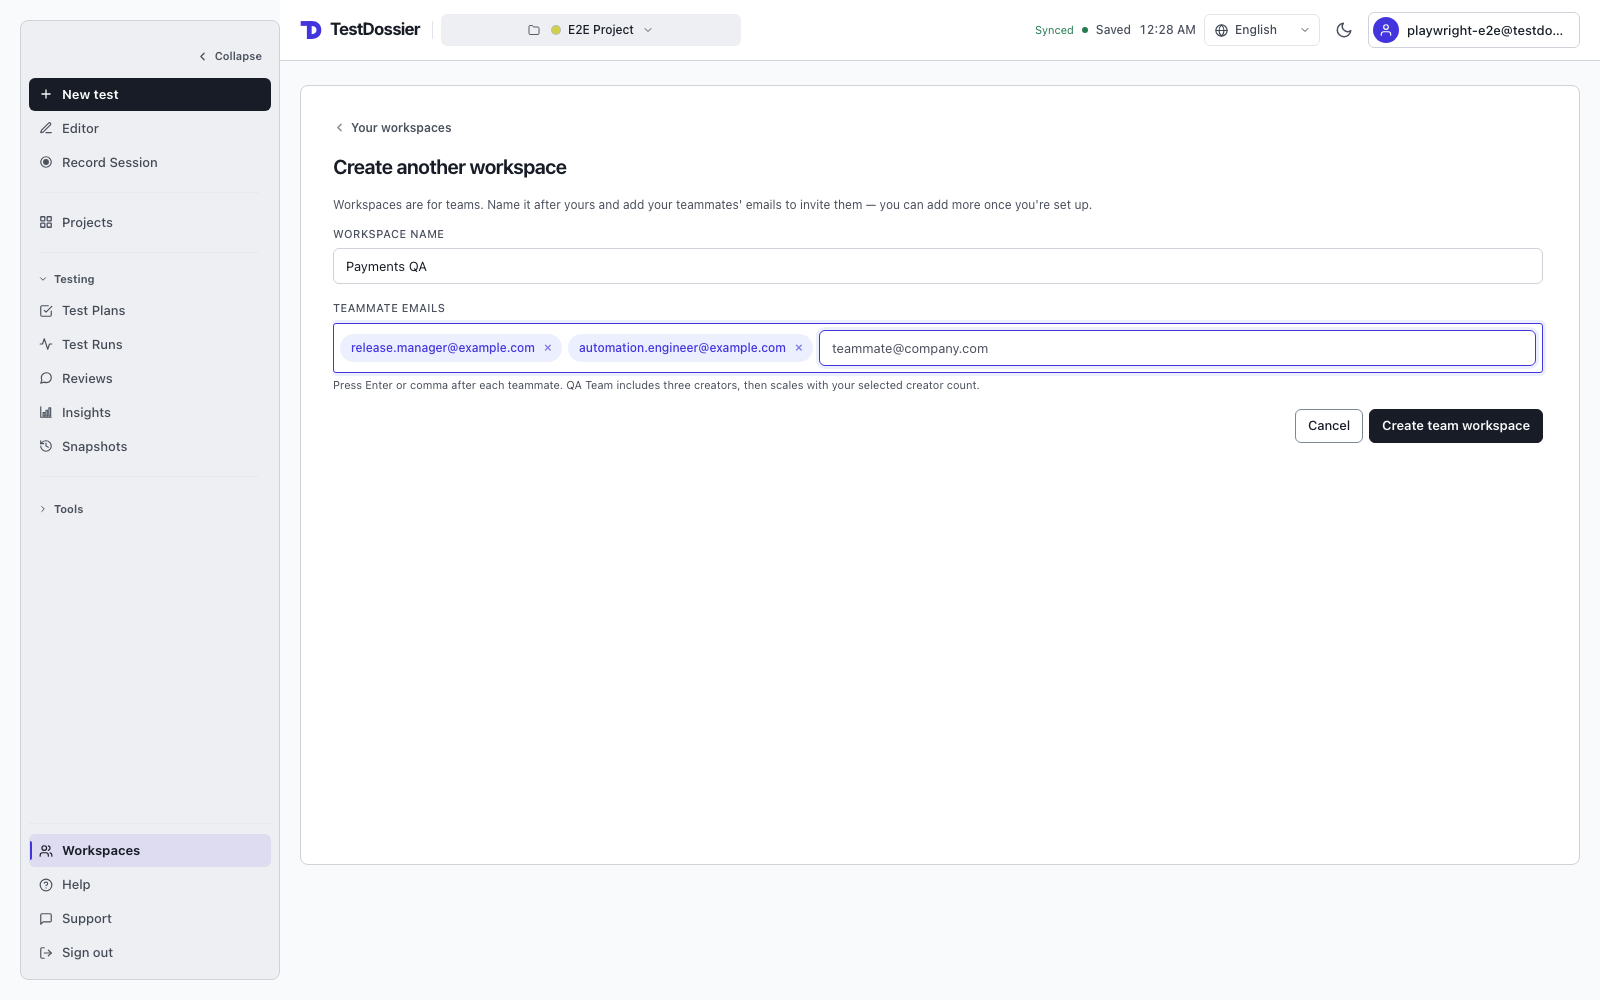
- Create: Account menu → Workspaces → Create team workspace. Your first workspace gets a one-time 14-day QA Team trial. After that trial, the workspace needs its own QA Team subscription; a personal Pro plan does not cover team workspace access.
- Invite: from workspace settings, enter an email and choose owner, admin, or member. Owners manage billing, roles, and danger-zone actions. Admins manage invites, members, workspace details, and branding. Members create and edit shared work but cannot manage people.
- Switch context: the workspace pill in the top bar is your current scope. Click ← Switch to Personal to leave the shared space; clicking a workspace name in the account menu switches into it. The pill is color-coded so you always know which scope you're editing.
- What's shared: projects, cases, test runs, snapshots, plans, evidence, branding, report comments, and presence created in workspace context. Items in Personal remain private.
- Membership lifecycle: open Workspaces at the bottom of the sidebar to leave or manage a workspace. Removed members lose access immediately, but their authored content remains. Workspaces can be archived or permanently deleted with confirmation.
Features carrying the QA Team badge require an active workspace. Insights and multi-snapshot report sharing are also available for personal QA Pro projects.
Plans and data
Anonymous, Free, and QA Pro at a glance
| Anonymous | Free (signed in) | QA Pro | |
|---|---|---|---|
| Test cases | Unlimited | Unlimited | Unlimited |
| Projects | Unlimited local | Unlimited local | Unlimited cloud |
| Test plans | Unlimited local | Unlimited local | Unlimited cloud |
| Recently Deleted | 30 days · this browser | 30 days · this browser | 30 days · cloud synced |
| Step Library | This browser | Cloud synced | Cloud synced |
| QA Pro tools | — | — | ✓ and more (hover) |
| Survives clearing browser data | — | Account survives, projects don't | Cloud synced |
Keyboard Shortcuts
| Ctrl/⌘+V | Paste screenshot anywhere on the page → drops into the active step |
| Ctrl/⌘+Enter | Add a new step |
| Ctrl/⌘+D | Duplicate the active step (action/expected/data carry over; result resets to Pending so the duplicate doesn't silently claim PASS) |
| 1 / 2 / 3 / 4 / 5 | Mark the active step PASS / FAIL / BLOCKED / SKIPPED / PENDING |
| Alt+↑ / Alt+↓ | Reorder the active step |
| Ctrl/⌘+/ | Focus the step filter (search by text or result) |
| Shift+click a checkbox | Range-select every step between the last clicked checkbox and this one (Gmail-style — adopts the anchor's checked/unchecked state) |
| Esc | Clear the current bulk selection (only when the bulk toolbar is showing and you're not editing a text field) |
Mouse actions
- Select a step to make it active (the target for
Ctrl/⌘+V). - Select a step row to open its detail line: hidden columns and defect notes appear under the row.
- Drag the handle at the left of a step row to reorder steps.
- Tick the checkbox on the left of a step row to select it for bulk actions — mark many as PASS/SKIPPED, or delete a batch at once. Selection survives status changes and reorders. Shift-click another checkbox to extend.
- Open the ⋯ menu at the right of a step row to duplicate, move, or delete it.
- Click any screenshot to open it at full size.
- Click the edit icon on a screenshot to annotate.
- Select a section header in the Details rail, such as Classification, Specification, Run / Execution, or Notes, to expand or collapse it.
Tips & Gotchas
Where your data lives
Anonymous and Free projects are local: test cases, runs, snapshots, and evidence stay in this browser's IndexedDB. Signing in to Free syncs account-level items such as your reusable Step Library and enables Free share links, but it does not move personal projects to the cloud. Different browsers, profiles, URLs, and private windows have separate local storage.
Pro projects are cloud-synced: personal projects, cases, runs, snapshots, and uploaded evidence follow your account across devices. QA Team data is stored in the workspace and visible to its members. Signing out clears this device's synced cache; signing back in reloads cloud data. Use Sign out and forget this device on a shared machine to also clear device preferences.
Backing up your work
Even with cloud sync, keep periodic local backups. Use ZIP Bundle (current test case) for one case, All Open Test Cases ZIP for open cases, or expand Tools and choose Export → Entire project → TestDossier ZIP for a complete project backup.
Bug ticket options reset when a test case closes
Redaction / sensitive data
Also: don't paste real passwords into the Test Data field. Use references like "password in 1Password vault X" instead.
Duplicate filenames
Two screenshots with the same name collide in Jira (only one renders). The tool warns you when duplicates exist and the filename input turns red. Rename them to unique values.
Large test cases
With compression, typical test cases are well under browser storage limits. If one test case contains hundreds of full-resolution screenshots, IndexedDB may refuse to save it. The save indicator turns red when that happens. Export and archive the case before reducing its evidence.
Jira output looks dense in the Markup tab
The raw Jira wiki syntax (pipes, dashes, {color} tags) reads messy. Switch to the Preview tab to see what it'll actually look like when rendered in Jira — that's the tab to judge output by.
FAQ
Where did my test case go?
Closing a test case in the editor does not delete it when it contains content. Open Projects, select the project, find the test case in its Cases list, and choose Open in editor.
If a stakeholder changes their verdict, can I see the history?
Yes. Every cast and recast is preserved; the latest verdict is active, and prior decisions stay in the share's history. Open Testing → Reviews, select the report, and use Show prior casts for that reviewer. Revoking removes the public report, while its verdict and verified-signature ledger remains in the account data export for 12 months.
Can I remove a client comment from a shared report?
Yes. Open Testing → Reviews, choose the report, then select Remove on the comment. You can record an optional moderator-only reason. The public discussion keeps a removal notice, and the share creator or a workspace owner can restore the comment later.
How do I get a verified, identifiable sign-off (not just a typed email)?
When creating a share, enable Require email-verified sign-off. Reviewers confirm a one-time code sent to the address they enter before their verdict counts. This proves control of the mailbox, not legal identity, and no reviewer account is required. You can optionally restrict sign-off to listed email addresses. Open Testing → Reviews and select the report to inspect signed verdicts and prior casts. Each signer automatically receives a PDF copy of the report by email, stamped with the report’s content fingerprint — their record survives even if the share is later revoked.
Can I share this with teammates?
Two ways. One-off: use Share in the editor toolbar to publish the active case as a read-only link; viewers do not need an account. Manage or revoke the link later from Testing → Reviews. Ongoing team work: open Workspaces in the sidebar account area, create a QA Team workspace, and invite members by email. Projects and evidence created in that workspace are visible to its members.
Share access and analytics: every share keeps an anonymous total open count. Signed-in users can opt into detailed analytics for time, referrer host, and country; it is off by default for a new account. Turning it off in Reviews erases those detailed rows without resetting the total. Password protection is available on shared links. QA Pro adds flexible expiry instead of Free's fixed retention window.
How does a team workspace work?
A workspace is a shared container for projects, cases, runs, snapshots, and evidence. Members create and edit shared work. Admins also manage invites, members, workspace details, and branding. Owners additionally control billing, role changes, and danger-zone actions. The workspace needs its own active QA Team trial or subscription; a member's personal QA Pro plan does not keep it active. Switching to Personal keeps personal projects private.
Can multiple people edit the same test case simultaneously?
No. Presence indicators are live, but case editing is not collaborative text editing. If two people edit the same case, stale-save protection can return a conflict and ask one person to refresh. Coordinate ownership of a case or work in separate cases.
Does this work offline?
Local authoring and exports can continue after the app has loaded. Cloud sync, QA Team workspace access, sharing, CI ingestion, and other server-backed features require a network connection.
Will my test cases survive a browser update?
Normally. IndexedDB generally persists across browser updates, but clearing site data, private browsing, storage pressure, browser policy, or changing browsers or profiles can remove local data. Keep a periodic TestDossier backup for important anonymous or Free projects.
Can I connect it directly to TestRail/PractiTest without the CSV step?
Not currently. Use Tools → Export to create the vendor-formatted file, inspect it, then import it with TestRail's or PractiTest's importer. TestDossier does not ask for credentials to either service.
Do I need an account?
No. You can capture, document, and export without an account; that work stays in this browser. A free sign-in syncs your reusable Step Library, enables limited 30-day share links, and lets you join a workspace. QA Pro is required to sync personal projects, history, and evidence across devices. QA Team provides a shared workspace for creators; reviewers do not need a paid seat.
Who runs TestDossier / where does my data go?
TestDossier runs on Cloudflare infrastructure. Anonymous and Free project authoring stays in your browser unless you use a server feature such as sharing. Free account records and the reusable Step Library are account-backed. QA Pro personal projects and QA Team workspace data are cloud-backed; workspace data is visible to workspace members. You can export or delete your account from Account settings.
Cancelling stops renewal, and QA Pro remains active through the paid term. When it ends, personal cloud data enters a 30-day grace period. Re-subscribe during that window to restore full in-app access. Before the deadline, download the re-importable cases-and-evidence ZIP and the account-data JSON archive. The account-data JSON is an archive, not a one-click restore file. Cancelling does not erase separate anonymous or Free projects already stored in this browser. Deleting the account erases personal account data immediately. See Terms §6.